Capital One 2015 Annual Report Download - page 120
Download and view the complete annual report
Please find page 120 of the 2015 Capital One annual report below. You can navigate through the pages in the report by either clicking on the pages listed below, or by using the keyword search tool below to find specific information within the annual report.-
 1
1 -
2
-
3
-
4
-
5
-
6
-
7
-
8
-
9
-
10
-
11
-
12
-
13
-
14
-
15
-
16
-
17
-
18
-
19
-
20
-
21
-
22
-
23
-
24
-
25
-
26
-
27
-
28
-
29
-
30
-
31
-
32
-
33
-
34
-
35
-
36
-
37
-
38
-
39
-
40
-
41
-
42
-
43
-
44
-
45
-
46
-
47
-
48
-
49
-
50
-
51
-
52
-
53
-
54
-
55
-
56
-
57
-
58
-
59
-
60
-
61
-
62
-
63
-
64
-
65
-
66
-
67
-
68
-
69
-
70
-
71
-
72
-
73
-
74
-
75
-
76
-
77
-
78
-
79
-
80
-
81
-
82
-
83
-
84
-
85
-
86
-
87
-
88
-
89
-
90
-
91
-
92
-
93
-
94
-
95
-
96
-
97
-
98
-
99
-
100
-
101
-
102
-
103
-
104
-
105
-
106
-
107
-
108
-
109
-
 110
110 -
 111
111 -
 112
112 -
 113
113 -
 114
114 -
 115
115 -
 116
116 -
 117
117 -
 118
118 -
 119
119 -
 120
120 -
 121
121 -
 122
122 -
 123
123 -
 124
124 -
 125
125 -
 126
126 -
 127
127 -
 128
128 -
 129
129 -
 130
130 -
131
-
132
-
133
-
134
-
135
-
136
-
137
-
138
-
139
-
140
-
141
-
142
-
143
-
144
-
145
-
146
-
147
-
148
-
149
-
150
-
151
-
152
-
153
-
154
-
155
-
156
-
157
-
158
-
159
-
160
-
161
-
162
-
163
-
164
-
165
-
166
-
167
-
168
-
169
-
170
-
171
-
172
-
173
-
174
-
175
-
176
-
177
-
178
-
179
-
180
-
181
-
182
-
183
-
184
-
185
-
186
-
187
-
188
-
189
-
190
-
191
-
192
-
193
-
194
-
195
-
196
-
197
-
198
-
199
-
200
-
201
-
202
-
203
-
204
-
205
-
206
-
207
-
208
-
209
-
210
-
211
-
212
-
213
-
214
-
215
-
216
-
217
-
218
-
219
-
220
-
221
-
222
-
223
-
224
-
225
-
226
-
227
-
228
-
229
-
230
-
231
-
232
-
233
-
234
-
235
-
236
-
237
-
238
-
239
-
240
-
241
-
242
-
243
-
244
-
245
-
246
-
247
-
248
-
249
-
250
-
251
-
252
-
253
 |
 |

101 Capital One Financial Corporation (COF)
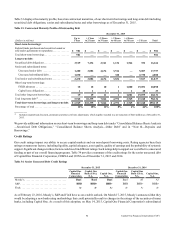
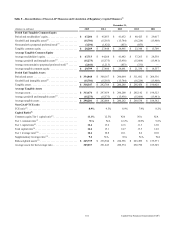
Table F—Reconciliation of Non-GAAP Measures and Calculation of Regulatory Capital Measures(1)
December 31,
(Dollars in millions) 2015 2014 2013 2012 2011
Period End Tangible Common Equity
Period end stockholders’ equity . . . . . . . . . . . . . . . . . . . . . . . $ 47,284 $ 45,053 $ 41,632 $ 40,425 $ 29,617
Goodwill and intangible assets(2) . . . . . . . . . . . . . . . . . . . . . . (15,701) (15,383) (15,784) (16,224) (13,908)
Noncumulative perpetual preferred stock(3) . . . . . . . . . . . . . . (3,294) (1,822) (853) (853) —
Tangible common equity . . . . . . . . . . . . . . . . . . . . . . . . . . . . $ 28,289 $ 27,848 $ 24,995 $ 23,348 $ 15,709
Average Tangible Common Equity
Average stockholders' equity . . . . . . . . . . . . . . . . . . . . . . . . . $ 47,713 $ 44,268 $ 41,482 $ 37,265 $ 28,538
Average goodwill and intangible assets(2) . . . . . . . . . . . . . . . (15,273) (15,575) (15,938) (15,604) (13,981)
Average noncumulative perpetual preferred stock(3) . . . . . . . (2,641) (1,213) (853) (331) —
Average tangible common equity. . . . . . . . . . . . . . . . . . . . . . $ 29,799 $ 27,480 $ 24,691 $ 21,330 $ 14,557
Period End Tangible Assets
Period end assets . . . . . . . . . . . . . . . . . . . . . . . . . . . . . . . . . . $ 334,048 $ 308,167 $ 296,064 $ 311,682 $ 204,336
Goodwill and intangible assets(2) . . . . . . . . . . . . . . . . . . . . . . (15,701) (15,383) (15,784) (16,224) (13,908)
Tangible assets . . . . . . . . . . . . . . . . . . . . . . . . . . . . . . . . . . . . $ 318,347 $ 292,784 $ 280,280 $ 295,458 $ 190,428
Average Tangible Assets
Average assets . . . . . . . . . . . . . . . . . . . . . . . . . . . . . . . . . . . . $ 313,474 $ 297,659 $ 296,200 $ 285,142 $ 198,323
Average goodwill and intangible assets(2) . . . . . . . . . . . . . . . (15,273) (15,575) (15,938) (15,604) (13,981)
Average tangible assets . . . . . . . . . . . . . . . . . . . . . . . . . . . . . $ 298,201 $ 282,084 $ 280,262 $ 269,538 $ 184,342
Non-GAAP TCE ratio
TCE ratio(4) . . . . . . . . . . . . . . . . . . . . . . . . . . . . . . . . . . . . . . . 8.9% 9.5% 8.9% 7.9% 8.2%
Capital Ratios(5)
Common equity Tier 1 capital ratio(6). . . . . . . . . . . . . . . . . . . 11.1% 12.5% N/A N/A N/A
Tier 1 common ratio(7) . . . . . . . . . . . . . . . . . . . . . . . . . . . . . . N/A N/A 12.2% 10.9% 9.6%
Tier 1 capital ratio(8) . . . . . . . . . . . . . . . . . . . . . . . . . . . . . . . . 12.4 13.2 12.6 11.3 12.0
Total capital ratio(9) . . . . . . . . . . . . . . . . . . . . . . . . . . . . . . . . . 14.6 15.1 14.7 13.5 14.8
Tier 1 leverage ratio(10) . . . . . . . . . . . . . . . . . . . . . . . . . . . . . . 10.6 10.8 10.1 8.6 10.0
Supplementary leverage ratio(11). . . . . . . . . . . . . . . . . . . . . . . 9.2 N/A N/A N/A N/A
Risk-weighted assets(12) . . . . . . . . . . . . . . . . . . . . . . . . . . . . . $ 265,739 $ 236,944 $ 224,556 $ 223,499 $ 155,571
Average assets for the leverage ratio . . . . . . . . . . . . . . . . . . . 309,037 291,243 280,574 292,790 185,349