Capital One 2015 Annual Report Download - page 203
Download and view the complete annual report
Please find page 203 of the 2015 Capital One annual report below. You can navigate through the pages in the report by either clicking on the pages listed below, or by using the keyword search tool below to find specific information within the annual report.-
 1
1 -
2
-
3
-
4
-
5
-
6
-
7
-
8
-
9
-
10
-
11
-
12
-
13
-
14
-
15
-
16
-
17
-
18
-
19
-
20
-
21
-
22
-
23
-
24
-
25
-
26
-
27
-
28
-
29
-
30
-
31
-
32
-
33
-
34
-
35
-
36
-
37
-
38
-
39
-
40
-
41
-
42
-
43
-
44
-
45
-
46
-
47
-
48
-
49
-
50
-
51
-
52
-
53
-
54
-
55
-
56
-
57
-
58
-
59
-
60
-
61
-
62
-
63
-
64
-
65
-
66
-
67
-
68
-
69
-
70
-
71
-
72
-
73
-
74
-
75
-
76
-
77
-
78
-
79
-
80
-
81
-
82
-
83
-
84
-
85
-
86
-
87
-
88
-
89
-
90
-
91
-
92
-
93
-
94
-
95
-
96
-
97
-
98
-
99
-
100
-
101
-
102
-
103
-
104
-
105
-
106
-
107
-
108
-
109
-
110
-
111
-
112
-
113
-
114
-
115
-
116
-
117
-
118
-
119
-
120
-
121
-
122
-
123
-
124
-
125
-
126
-
127
-
128
-
129
-
130
-
131
-
132
-
133
-
134
-
135
-
136
-
137
-
138
-
139
-
140
-
141
-
142
-
143
-
144
-
145
-
146
-
147
-
148
-
149
-
150
-
151
-
152
-
153
-
154
-
155
-
156
-
157
-
158
-
159
-
160
-
161
-
162
-
163
-
164
-
165
-
166
-
167
-
168
-
169
-
170
-
171
-
172
-
173
-
174
-
175
-
176
-
177
-
178
-
179
-
180
-
181
-
182
-
183
-
184
-
185
-
186
-
187
-
188
-
189
-
190
-
191
-
192
-
 193
193 -
 194
194 -
 195
195 -
 196
196 -
 197
197 -
 198
198 -
 199
199 -
 200
200 -
 201
201 -
 202
202 -
 203
203 -
 204
204 -
 205
205 -
 206
206 -
 207
207 -
 208
208 -
 209
209 -
 210
210 -
 211
211 -
 212
212 -
 213
213 -
214
-
215
-
216
-
217
-
218
-
219
-
220
-
221
-
222
-
223
-
224
-
225
-
226
-
227
-
228
-
229
-
230
-
231
-
232
-
233
-
234
-
235
-
236
-
237
-
238
-
239
-
240
-
241
-
242
-
243
-
244
-
245
-
246
-
247
-
248
-
249
-
250
-
251
-
252
-
253
 |
 |

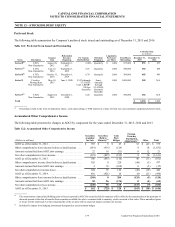
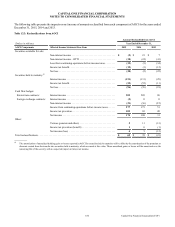
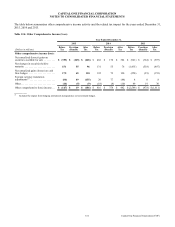
CAPITAL ONE FINANCIAL CORPORATION
NOTES TO CONSOLIDATED FINANCIAL STATEMENTS
184 Capital One Financial Corporation (COF)
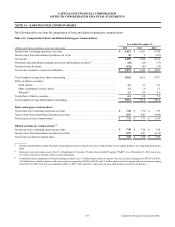
NOTE 14—EARNINGS PER COMMON SHARE
The following table sets forth the computation of basic and diluted earnings per common share:
Table 14.1: Computation of Basic and Diluted Earnings per Common Share
Year Ended December 31,
(Dollars and shares in millions, except per share data) 2015 2014 2013
Income from continuing operations, net of tax . . . . . . . . . . . . . . . . . . . . . . . . . . . . . . . . . . . . . . . . . . $ 4,012 $ 4,423 4,354
Income (loss) from discontinued operations, net of tax . . . . . . . . . . . . . . . . . . . . . . . . . . . . . . . . . . . 38 5 (233)
Net income . . . . . . . . . . . . . . . . . . . . . . . . . . . . . . . . . . . . . . . . . . . . . . . . . . . . . . . . . . . . . . . . . . . . . 4,050 4,428 4,121
Dividends and undistributed earnings allocated to participating securities(1) . . . . . . . . . . . . . . . . . . . (20) (18) (17)
Preferred stock dividends . . . . . . . . . . . . . . . . . . . . . . . . . . . . . . . . . . . . . . . . . . . . . . . . . . . . . . . . . . (158) (67) (53)
Net income available to common stockholders. . . . . . . . . . . . . . . . . . . . . . . . . . . . . . . . . . . . . . . . . . $ 3,872 $ 4,343 $ 4,051
Total weighted-average basic shares outstanding . . . . . . . . . . . . . . . . . . . . . . . . . . . . . . . . . . . . . . . . 541.8 563.1 579.7
Effect of dilutive securities:
Stock options . . . . . . . . . . . . . . . . . . . . . . . . . . . . . . . . . . . . . . . . . . . . . . . . . . . . . . . . . . . . . . . . . 2.6 2.7 2.2
Other contingently issuable shares. . . . . . . . . . . . . . . . . . . . . . . . . . . . . . . . . . . . . . . . . . . . . . . . . 1.3 1.6 1.5
Warrants(2) . . . . . . . . . . . . . . . . . . . . . . . . . . . . . . . . . . . . . . . . . . . . . . . . . . . . . . . . . . . . . . . . . . . 2.3 4.5 4.2
Total effect of dilutive securities. . . . . . . . . . . . . . . . . . . . . . . . . . . . . . . . . . . . . . . . . . . . . . . . . . . . . 6.2 8.8 7.9
Total weighted-average diluted shares outstanding . . . . . . . . . . . . . . . . . . . . . . . . . . . . . . . . . . . . . . 548.0 571.9 587.6
Basic earnings per common share:
Net income from continuing operations per share . . . . . . . . . . . . . . . . . . . . . . . . . . . . . . . . . . . . . . . $ 7.08 $ 7.70 $ 7.39
Income (loss) from discontinued operations per share . . . . . . . . . . . . . . . . . . . . . . . . . . . . . . . . . . . . 0.07 0.01 (0.40)
Net income per basic common share. . . . . . . . . . . . . . . . . . . . . . . . . . . . . . . . . . . . . . . . . . . . . . . . . . $ 7.15 $ 7.71 $ 6.99
Diluted earnings per common share:(3)
Net income from continuing operations per share . . . . . . . . . . . . . . . . . . . . . . . . . . . . . . . . . . . . . . . $ 7.00 $ 7.58 $ 7.28
Income (loss) from discontinued operations per share . . . . . . . . . . . . . . . . . . . . . . . . . . . . . . . . . . . . 0.07 0.01 (0.39)
Net income per diluted common share . . . . . . . . . . . . . . . . . . . . . . . . . . . . . . . . . . . . . . . . . . . . . . . . $ 7.07 $ 7.59 $ 6.89
__________
(1) Includes undistributed earnings allocated to participating securities using the two-class method under the accounting guidance for computing earnings per
share.
(2) Represents warrants issued as part of the U.S. Department of Treasury’s Troubled Assets Relief Program (“TARP”). As of December 31, 2015, there were
4.1 million warrants to purchase common stock outstanding.
(3) Excluded from the computation of diluted earnings per share were 1.9 million shares related to options with exercise prices ranging from $70.96 to $88.81,
2.9 million shares related to options with exercise prices ranging from $70.96 to $88.81 and 5.2 million shares related to options with exercise prices ranging
from $56.28 to $88.81 for the years ended December 31, 2015, 2014 and 2013, respectively, because their inclusion would be anti-dilutive.