Capital One 2015 Annual Report Download - page 68
Download and view the complete annual report
Please find page 68 of the 2015 Capital One annual report below. You can navigate through the pages in the report by either clicking on the pages listed below, or by using the keyword search tool below to find specific information within the annual report.-
 1
1 -
2
-
3
-
4
-
5
-
6
-
7
-
8
-
9
-
10
-
11
-
12
-
13
-
14
-
15
-
16
-
17
-
18
-
19
-
20
-
21
-
22
-
23
-
24
-
25
-
26
-
27
-
28
-
29
-
30
-
31
-
32
-
33
-
34
-
35
-
36
-
37
-
38
-
39
-
40
-
41
-
42
-
43
-
44
-
45
-
46
-
47
-
48
-
49
-
50
-
51
-
52
-
53
-
54
-
55
-
56
-
57
-
 58
58 -
 59
59 -
 60
60 -
 61
61 -
 62
62 -
 63
63 -
 64
64 -
 65
65 -
 66
66 -
 67
67 -
 68
68 -
 69
69 -
 70
70 -
 71
71 -
 72
72 -
 73
73 -
 74
74 -
 75
75 -
 76
76 -
 77
77 -
 78
78 -
79
-
80
-
81
-
82
-
83
-
84
-
85
-
86
-
87
-
88
-
89
-
90
-
91
-
92
-
93
-
94
-
95
-
96
-
97
-
98
-
99
-
100
-
101
-
102
-
103
-
104
-
105
-
106
-
107
-
108
-
109
-
110
-
111
-
112
-
113
-
114
-
115
-
116
-
117
-
118
-
119
-
120
-
121
-
122
-
123
-
124
-
125
-
126
-
127
-
128
-
129
-
130
-
131
-
132
-
133
-
134
-
135
-
136
-
137
-
138
-
139
-
140
-
141
-
142
-
143
-
144
-
145
-
146
-
147
-
148
-
149
-
150
-
151
-
152
-
153
-
154
-
155
-
156
-
157
-
158
-
159
-
160
-
161
-
162
-
163
-
164
-
165
-
166
-
167
-
168
-
169
-
170
-
171
-
172
-
173
-
174
-
175
-
176
-
177
-
178
-
179
-
180
-
181
-
182
-
183
-
184
-
185
-
186
-
187
-
188
-
189
-
190
-
191
-
192
-
193
-
194
-
195
-
196
-
197
-
198
-
199
-
200
-
201
-
202
-
203
-
204
-
205
-
206
-
207
-
208
-
209
-
210
-
211
-
212
-
213
-
214
-
215
-
216
-
217
-
218
-
219
-
220
-
221
-
222
-
223
-
224
-
225
-
226
-
227
-
228
-
229
-
230
-
231
-
232
-
233
-
234
-
235
-
236
-
237
-
238
-
239
-
240
-
241
-
242
-
243
-
244
-
245
-
246
-
247
-
248
-
249
-
250
-
251
-
252
-
253
 |
 |

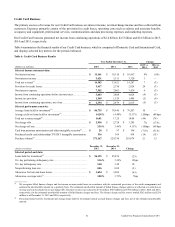
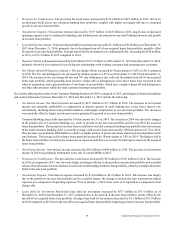
49 Capital One Financial Corporation (COF)
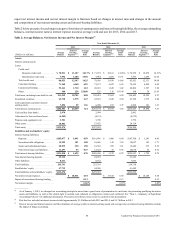
Non-Interest Expense
Non-interest expense consists of ongoing operating expenses, such as salaries and associate benefits, occupancy and equipment
costs, professional services, communications and data processing expenses and other non-interest expenses, as well as marketing
costs and amortization of intangibles.
Table 5 displays the components of non-interest expense for 2015, 2014 and 2013.
Table 5: Non-Interest Expense
Year Ended December 31,
(Dollars in millions) 2015 2014 2013
Salaries and associate benefits . . . . . . . . . . . . . . . . . . . . . . . . . . . . . . . . . . . . . . . . . . . . . . . . . . . . $ 4,975 $ 4,593 $ 4,480
Occupancy and equipment . . . . . . . . . . . . . . . . . . . . . . . . . . . . . . . . . . . . . . . . . . . . . . . . . . . . . . . 1,829 1,745 1,541
Marketing . . . . . . . . . . . . . . . . . . . . . . . . . . . . . . . . . . . . . . . . . . . . . . . . . . . . . . . . . . . . . . . . . . . . 1,744 1,561 1,373
Professional services . . . . . . . . . . . . . . . . . . . . . . . . . . . . . . . . . . . . . . . . . . . . . . . . . . . . . . . . . . . 1,292 1,216 1,347
Communications and data processing . . . . . . . . . . . . . . . . . . . . . . . . . . . . . . . . . . . . . . . . . . . . . . 883 798 897
Amortization of intangibles . . . . . . . . . . . . . . . . . . . . . . . . . . . . . . . . . . . . . . . . . . . . . . . . . . . . . . 430 532 671
Other non-interest expense:
Collections . . . . . . . . . . . . . . . . . . . . . . . . . . . . . . . . . . . . . . . . . . . . . . . . . . . . . . . . . . . . . . . . 322 372 470
Fraud losses. . . . . . . . . . . . . . . . . . . . . . . . . . . . . . . . . . . . . . . . . . . . . . . . . . . . . . . . . . . . . . . . 316 275 218
Bankcard, regulatory and other fee assessments. . . . . . . . . . . . . . . . . . . . . . . . . . . . . . . . . . . . 444 465 562
Other . . . . . . . . . . . . . . . . . . . . . . . . . . . . . . . . . . . . . . . . . . . . . . . . . . . . . . . . . . . . . . . . . . . . . 761 623 794
Other non-interest expense. . . . . . . . . . . . . . . . . . . . . . . . . . . . . . . . . . . . . . . . . . . . . . . . . . . . . . . 1,843 1,735 2,044
Total non-interest expense . . . . . . . . . . . . . . . . . . . . . . . . . . . . . . . . . . . . . . . . . . . . . . . . . . . . . . . $ 12,996 $ 12,180 $ 12,353
Non-interest expense increased by $816 million to $13.0 billion in 2015 compared to 2014. The increase was primarily due to (i)
higher personnel expenses and charges for severance and related benefits pursuant to our ongoing benefit programs and certain
site closures, as a result of the realignment of our workforce; (ii) higher operating and marketing expenses associated with loan
growth, as well as acquisition and operating expenses related to the GE Healthcare acquisition; and (iii) continued technology and
infrastructure investments. These increases were partially offset by a decline in the amortization of intangibles.
Non-interest expense decreased by $173 million, to $12.2 billion in 2014 compared to 2013. The decrease reflects a decline in the
amortization of intangibles and a reduction in acquisition-related costs and provision for litigation matters. These were partially
offset by (i) higher marketing expenses associated with loan growth; (ii) higher operating expenses attributable to growth in our
commercial and auto loan portfolios; and (iii) the change to include auto repossession-related expenses as a component of operating
expenses (prior to January 1, 2014 these costs were reported as a component of net charge-offs), partially offset by lower bankcard,
regulatory and other fee assessments and communications and data processing expenses.
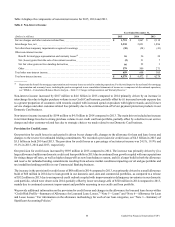
Income (Loss) from Discontinued Operations, Net of Tax
Income (loss) from discontinued operations reflects ongoing costs, which primarily consist of mortgage loan repurchase
representation and warranty charges, related to the mortgage origination operations of our former wholesale mortgage banking
unit, GreenPoint Mortgage Funding, Inc. (“GreenPoint”), which was closed in 2007. Income from discontinued operations, net of
tax, was $38 million in 2015, compared to income from discontinued operations of $5 million in 2014 and a loss from discontinued
operations of $233 million in 2013. We recorded a benefit net of tax for mortgage representation and warranty reserve of $41
million ($64 million before tax) in 2015, compared to a $4 million benefit net of tax ($7 million before tax) and a provision net
of tax of $210 million ($333 million before tax) in 2014 and 2013, respectively.
We provide additional information on the net provision for mortgage representation and warranty losses and the related reserve
for representation and warranty claims in “Consolidated Balance Sheets Analysis—Mortgage Representation and Warranty
Reserve” and “Note 21—Commitments, Contingencies, Guarantees and Others.”