Capital One 2015 Annual Report Download - page 77
Download and view the complete annual report
Please find page 77 of the 2015 Capital One annual report below. You can navigate through the pages in the report by either clicking on the pages listed below, or by using the keyword search tool below to find specific information within the annual report.-
 1
1 -
2
-
3
-
4
-
5
-
6
-
7
-
8
-
9
-
10
-
11
-
12
-
13
-
14
-
15
-
16
-
17
-
18
-
19
-
20
-
21
-
22
-
23
-
24
-
25
-
26
-
27
-
28
-
29
-
30
-
31
-
32
-
33
-
34
-
35
-
36
-
37
-
38
-
39
-
40
-
41
-
42
-
43
-
44
-
45
-
46
-
47
-
48
-
49
-
50
-
51
-
52
-
53
-
54
-
55
-
56
-
57
-
58
-
59
-
60
-
61
-
62
-
63
-
64
-
65
-
66
-
 67
67 -
 68
68 -
 69
69 -
 70
70 -
 71
71 -
 72
72 -
 73
73 -
 74
74 -
 75
75 -
 76
76 -
 77
77 -
 78
78 -
 79
79 -
 80
80 -
 81
81 -
 82
82 -
 83
83 -
 84
84 -
 85
85 -
 86
86 -
 87
87 -
88
-
89
-
90
-
91
-
92
-
93
-
94
-
95
-
96
-
97
-
98
-
99
-
100
-
101
-
102
-
103
-
104
-
105
-
106
-
107
-
108
-
109
-
110
-
111
-
112
-
113
-
114
-
115
-
116
-
117
-
118
-
119
-
120
-
121
-
122
-
123
-
124
-
125
-
126
-
127
-
128
-
129
-
130
-
131
-
132
-
133
-
134
-
135
-
136
-
137
-
138
-
139
-
140
-
141
-
142
-
143
-
144
-
145
-
146
-
147
-
148
-
149
-
150
-
151
-
152
-
153
-
154
-
155
-
156
-
157
-
158
-
159
-
160
-
161
-
162
-
163
-
164
-
165
-
166
-
167
-
168
-
169
-
170
-
171
-
172
-
173
-
174
-
175
-
176
-
177
-
178
-
179
-
180
-
181
-
182
-
183
-
184
-
185
-
186
-
187
-
188
-
189
-
190
-
191
-
192
-
193
-
194
-
195
-
196
-
197
-
198
-
199
-
200
-
201
-
202
-
203
-
204
-
205
-
206
-
207
-
208
-
209
-
210
-
211
-
212
-
213
-
214
-
215
-
216
-
217
-
218
-
219
-
220
-
221
-
222
-
223
-
224
-
225
-
226
-
227
-
228
-
229
-
230
-
231
-
232
-
233
-
234
-
235
-
236
-
237
-
238
-
239
-
240
-
241
-
242
-
243
-
244
-
245
-
246
-
247
-
248
-
249
-
250
-
251
-
252
-
253
 |
 |
58 Capital One Financial Corporation (COF)
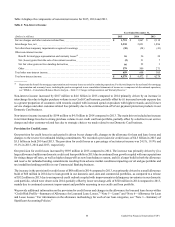
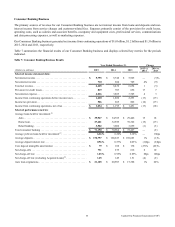
• Provision for Credit Losses: The provision for credit losses increased by $116 million to $819 million in 2015, driven by
an allowance build across our consumer banking loan portfolios, coupled with higher net charge-offs due to continued
growth in our auto loan portfolio.
• Non-Interest Expense: Non-interest expense increased by $157 million to $4.0 billion in 2015, largely due to increased
operating expenses due to continued technology and infrastructure investments in our retail banking business and growth
in our auto loan portfolio.
• Loans Held for Investment: Period-end loans held for investment decreased by $1.1 billion to $70.4 billion as of December 31,
2015 from December 31, 2014, primarily due to the planned run-off of our acquired home loan portfolio, partially offset
by growth in our auto loan portfolio. Average loans held for investment were substantially flat, increasing by $186 million,
or 0.3%, to $71.2 billion in 2015 compared to 2014.
• Deposits: Period-end deposits increased by $4.6 billion to $172.7 billion as of December 31, 2015 from December 31, 2014,
primarily driven by our continued focus on deposit relationships with existing customers and attracting new customers.
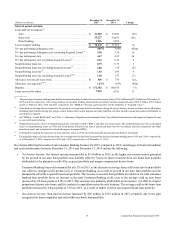
• Net Charge-off and Delinquency Statistics: The net charge-off rate increased by 8 basis points to 1.03% in 2015 compared
to 2014. The 30+ day delinquency rate increased by 44 basis points to 4.67% as of December 31, 2015 from December 31,
2014. The increase in the net charge-off rate and 30+ day delinquency rate reflected the planned run-off of our acquired
home loan portfolio, which generally does not have charge-offs or delinquencies since these loans were recorded at fair
value at acquisition, and a greater portion of auto loans in our portfolio, which have a higher charge-off and delinquency
rate than other products within the total consumer banking loan portfolio.
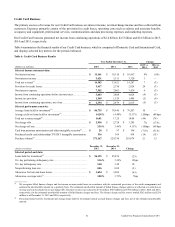
Key factors affecting the results of our Consumer Banking business for 2014, compared to 2013, and changes in financial condition
and credit performance between December 31, 2014 and December 31, 2013 include the following:
• Net Interest Income: Net interest income decreased by $157 million to $5.7 billion in 2014. The decrease in net interest
income was primarily attributable to compression in deposit spreads in retail banking due to the lower interest rate
environment, declining home loan portfolio balances, and margin compression in our auto loan portfolio. The decreases
were partially offset by higher net interest income generated by growth in our auto loan portfolio.
Consumer Banking loan yields increased by 16 basis points to 6.3% in 2014. The increase in 2014 was driven by changes
in the product mix in Consumer Banking as a result of growth in our auto loan portfolio and the run-off of the acquired
home loan portfolio. The increase in our auto loans in relation to our total consumer banking loan portfolio drove an increase
in the total Consumer Banking yield, even as the average yield on auto loans decreased by 109 basis points to 8.7% in 2014.
This decrease was primarily attributable to a shift to a higher portion of prime auto loans and increased competition in the
auto business. The average yield on home loans portfolio increased by 38 basis points to 3.8% in 2014. The higher yield in
the home loan portfolio was driven by an increase in expected cash flows as a result of credit improvement on the acquired
home loan portfolio.
• Non-Interest Income: Non-interest income decreased by $65 million to $684 million in 2014. The decrease in non-interest
income in 2014 was primarily attributable to the sale of certain MSRs in 2013.
• Provision for Credit Losses: The provision for credit losses increased by $47 million to $703 million in 2014. The increase
in 2014, as compared to 2013, was driven by higher net charge-offs due to the growth in our auto loan portfolio and a smaller
release of the allowance for loan and lease losses in the retail banking and home loan portfolios, offset by a smaller allowance
build in the auto loan portfolio.
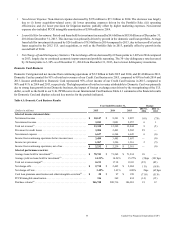
• Non-Interest Expense: Non-interest expense increased by $124 million to $3.9 billion in 2014. The increase was largely
due to the growth in our auto loan portfolio and to a smaller degree, the change to include the auto repossession-related
expenses as a component of operating expenses. Prior to January 1, 2014, these costs were reported as a component of net
charge-offs.
• Loans Held for Investment: Period-end loans held for investment increased by $677 million to $71.4 billion as of
December 31, 2014 from December 31, 2013, primarily due to the growth in the auto loan portfolio, mostly offset by the
run-off of our acquired home loan portfolio. Average loans held for investment decreased by $1.5 billion to $71.0 billion
in 2014 compared to 2013 due to the run-off in our acquired home loan portfolio outpacing growth in our auto loan portfolio.