Capital One 2015 Annual Report Download - page 109
Download and view the complete annual report
Please find page 109 of the 2015 Capital One annual report below. You can navigate through the pages in the report by either clicking on the pages listed below, or by using the keyword search tool below to find specific information within the annual report.-
 1
1 -
2
-
3
-
4
-
5
-
6
-
7
-
8
-
9
-
10
-
11
-
12
-
13
-
14
-
15
-
16
-
17
-
18
-
19
-
20
-
21
-
22
-
23
-
24
-
25
-
26
-
27
-
28
-
29
-
30
-
31
-
32
-
33
-
34
-
35
-
36
-
37
-
38
-
39
-
40
-
41
-
42
-
43
-
44
-
45
-
46
-
47
-
48
-
49
-
50
-
51
-
52
-
53
-
54
-
55
-
56
-
57
-
58
-
59
-
60
-
61
-
62
-
63
-
64
-
65
-
66
-
67
-
68
-
69
-
70
-
71
-
72
-
73
-
74
-
75
-
76
-
77
-
78
-
79
-
80
-
81
-
82
-
83
-
84
-
85
-
86
-
87
-
88
-
89
-
90
-
91
-
92
-
93
-
94
-
95
-
96
-
97
-
98
-
 99
99 -
 100
100 -
 101
101 -
 102
102 -
 103
103 -
 104
104 -
 105
105 -
 106
106 -
 107
107 -
 108
108 -
 109
109 -
 110
110 -
 111
111 -
 112
112 -
 113
113 -
 114
114 -
 115
115 -
 116
116 -
 117
117 -
 118
118 -
 119
119 -
120
-
121
-
122
-
123
-
124
-
125
-
126
-
127
-
128
-
129
-
130
-
131
-
132
-
133
-
134
-
135
-
136
-
137
-
138
-
139
-
140
-
141
-
142
-
143
-
144
-
145
-
146
-
147
-
148
-
149
-
150
-
151
-
152
-
153
-
154
-
155
-
156
-
157
-
158
-
159
-
160
-
161
-
162
-
163
-
164
-
165
-
166
-
167
-
168
-
169
-
170
-
171
-
172
-
173
-
174
-
175
-
176
-
177
-
178
-
179
-
180
-
181
-
182
-
183
-
184
-
185
-
186
-
187
-
188
-
189
-
190
-
191
-
192
-
193
-
194
-
195
-
196
-
197
-
198
-
199
-
200
-
201
-
202
-
203
-
204
-
205
-
206
-
207
-
208
-
209
-
210
-
211
-
212
-
213
-
214
-
215
-
216
-
217
-
218
-
219
-
220
-
221
-
222
-
223
-
224
-
225
-
226
-
227
-
228
-
229
-
230
-
231
-
232
-
233
-
234
-
235
-
236
-
237
-
238
-
239
-
240
-
241
-
242
-
243
-
244
-
245
-
246
-
247
-
248
-
249
-
250
-
251
-
252
-
253
 |
 |

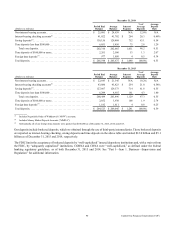
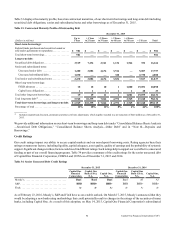
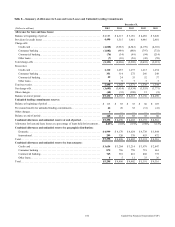
90 Capital One Financial Corporation (COF)
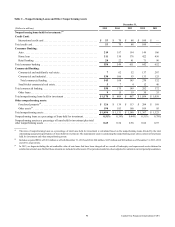
December 31, 2014
(Dollars in millions)
Period End
Balance
Average
Balance
Interest
Expense
% of
Average
Deposits
Average
Deposit
Rate
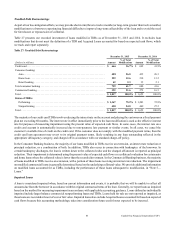
Non-interest bearing accounts. . . . . . . . . . . . . . . . . . . . . . . . . . . . . . . . . . . $ 25,081 $ 24,639 N/A 12.0% N/A
Interest-bearing checking accounts(1) . . . . . . . . . . . . . . . . . . . . . . . . . . . . . 41,022 41,702 $ 204 20.3 0.49%
Saving deposits(2). . . . . . . . . . . . . . . . . . . . . . . . . . . . . . . . . . . . . . . . . . . . . 130,156 129,868 752 63.1 0.58
Time deposits less than $100,000 . . . . . . . . . . . . . . . . . . . . . . . . . . . . . . . . 6,051 5,856 75 2.8 1.29
Total core deposits . . . . . . . . . . . . . . . . . . . . . . . . . . . . . . . . . . . . . . . . . 202,310 202,065 1,031 98.2 0.51
Time deposits of $100,000 or more. . . . . . . . . . . . . . . . . . . . . . . . . . . . . . . 2,261 2,560 53 1.3 2.07
Foreign time deposits(3) . . . . . . . . . . . . . . . . . . . . . . . . . . . . . . . . . . . . . . . . 977 1,050 4 0.5 0.34
Total deposits. . . . . . . . . . . . . . . . . . . . . . . . . . . . . . . . . . . . . . . . . . . . . . . . $ 205,548 $ 205,675 $ 1,088 100.0% 0.53
December 31, 2013
(Dollars in millions)
Period End
Balance
Average
Balance
Interest
Expense
% of
Average
Deposits
Average
Deposit
Rate
Non-interest bearing accounts. . . . . . . . . . . . . . . . . . . . . . . . . . . . . . . . . . . $ 22,643 $ 21,345 N/A 10.2% N/A
Interest-bearing checking accounts(1) . . . . . . . . . . . . . . . . . . . . . . . . . . . . . 43,880 43,823 $ 254 21.0 0.58%
Saving deposits(2). . . . . . . . . . . . . . . . . . . . . . . . . . . . . . . . . . . . . . . . . . . . . 127,667 129,373 714 61.8 0.55
Time deposits less than $100,000 . . . . . . . . . . . . . . . . . . . . . . . . . . . . . . . . 6,299 8,955 161 4.3 1.80
Total core deposits . . . . . . . . . . . . . . . . . . . . . . . . . . . . . . . . . . . . . . . . . 200,489 203,496 1,129 97.3 0.55
Time deposits of $100,000 or more. . . . . . . . . . . . . . . . . . . . . . . . . . . . . . . 2,852 3,938 108 1.9 2.74
Foreign time deposits(3) . . . . . . . . . . . . . . . . . . . . . . . . . . . . . . . . . . . . . . . . 1,182 1,611 4 0.8 0.25
Total deposits. . . . . . . . . . . . . . . . . . . . . . . . . . . . . . . . . . . . . . . . . . . . . . . . $ 204,523 $ 209,045 $ 1,241 100.0% 0.59
__________
(1) Includes Negotiable Order of Withdrawal (“NOW”) accounts.
(2) Includes Money Market Deposit Accounts (“MMDA”).
(3) Substantially all of our foreign time deposits were greater than $100,000 as of December 31, 2015, 2014 and 2013.
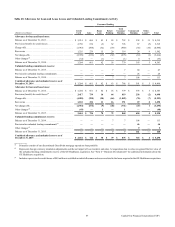
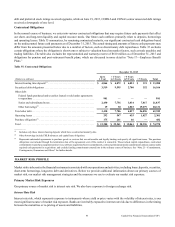
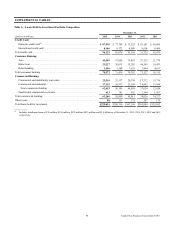
Our deposits include brokered deposits, which we obtained through the use of third-party intermediaries. Those brokered deposits
are reported as interest-bearing checking, saving deposits and time deposits in the above table and totaled $12.0 billion and $5.1
billion as of December 31, 2015 and 2014, respectively.
The FDIC limits the acceptance of brokered deposits by “well-capitalized” insured depository institutions and, with a waiver from
the FDIC, by “adequately capitalized” institutions. COBNA and CONA were “well-capitalized,” as defined under the federal
banking regulatory guidelines, as of both December 31, 2015 and 2014. See “Part I—Item 1. Business—Supervision and
Regulation” for additional information.