Capital One 2015 Annual Report Download - page 67
Download and view the complete annual report
Please find page 67 of the 2015 Capital One annual report below. You can navigate through the pages in the report by either clicking on the pages listed below, or by using the keyword search tool below to find specific information within the annual report.-
 1
1 -
2
-
3
-
4
-
5
-
6
-
7
-
8
-
9
-
10
-
11
-
12
-
13
-
14
-
15
-
16
-
17
-
18
-
19
-
20
-
21
-
22
-
23
-
24
-
25
-
26
-
27
-
28
-
29
-
30
-
31
-
32
-
33
-
34
-
35
-
36
-
37
-
38
-
39
-
40
-
41
-
42
-
43
-
44
-
45
-
46
-
47
-
48
-
49
-
50
-
51
-
52
-
53
-
54
-
55
-
56
-
 57
57 -
 58
58 -
 59
59 -
 60
60 -
 61
61 -
 62
62 -
 63
63 -
 64
64 -
 65
65 -
 66
66 -
 67
67 -
 68
68 -
 69
69 -
 70
70 -
 71
71 -
 72
72 -
 73
73 -
 74
74 -
 75
75 -
 76
76 -
 77
77 -
78
-
79
-
80
-
81
-
82
-
83
-
84
-
85
-
86
-
87
-
88
-
89
-
90
-
91
-
92
-
93
-
94
-
95
-
96
-
97
-
98
-
99
-
100
-
101
-
102
-
103
-
104
-
105
-
106
-
107
-
108
-
109
-
110
-
111
-
112
-
113
-
114
-
115
-
116
-
117
-
118
-
119
-
120
-
121
-
122
-
123
-
124
-
125
-
126
-
127
-
128
-
129
-
130
-
131
-
132
-
133
-
134
-
135
-
136
-
137
-
138
-
139
-
140
-
141
-
142
-
143
-
144
-
145
-
146
-
147
-
148
-
149
-
150
-
151
-
152
-
153
-
154
-
155
-
156
-
157
-
158
-
159
-
160
-
161
-
162
-
163
-
164
-
165
-
166
-
167
-
168
-
169
-
170
-
171
-
172
-
173
-
174
-
175
-
176
-
177
-
178
-
179
-
180
-
181
-
182
-
183
-
184
-
185
-
186
-
187
-
188
-
189
-
190
-
191
-
192
-
193
-
194
-
195
-
196
-
197
-
198
-
199
-
200
-
201
-
202
-
203
-
204
-
205
-
206
-
207
-
208
-
209
-
210
-
211
-
212
-
213
-
214
-
215
-
216
-
217
-
218
-
219
-
220
-
221
-
222
-
223
-
224
-
225
-
226
-
227
-
228
-
229
-
230
-
231
-
232
-
233
-
234
-
235
-
236
-
237
-
238
-
239
-
240
-
241
-
242
-
243
-
244
-
245
-
246
-
247
-
248
-
249
-
250
-
251
-
252
-
253
 |
 |

48 Capital One Financial Corporation (COF)
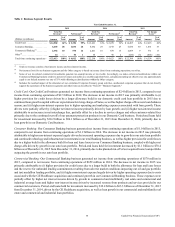
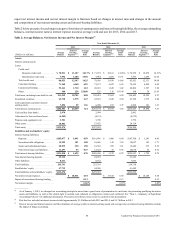
Table 4 displays the components of non-interest income for 2015, 2014 and 2013.
Table 4: Non-Interest Income
Year Ended December 31,
(Dollars in millions) 2015 2014 2013
Service charges and other customer-related fees . . . . . . . . . . . . . . . . . . . . . . . . . . . . . . . . . . . . $ 1,715 $ 1,867 $ 2,118
Interchange fees, net . . . . . . . . . . . . . . . . . . . . . . . . . . . . . . . . . . . . . . . . . . . . . . . . . . . . . . . . . 2,235 2,021 1,896
Net other-than-temporary impairment recognized in earnings . . . . . . . . . . . . . . . . . . . . . . . . . (30) (24) (41)
Other non-interest income:
Benefit for mortgage representation and warranty losses(1) . . . . . . . . . . . . . . . . . . . . . . . . . 16 26 24
Net (losses) gains from the sale of investment securities. . . . . . . . . . . . . . . . . . . . . . . . . . . (2) 21 7
Net fair value gains on free-standing derivatives . . . . . . . . . . . . . . . . . . . . . . . . . . . . . . . . . 66 52 3
Other . . . . . . . . . . . . . . . . . . . . . . . . . . . . . . . . . . . . . . . . . . . . . . . . . . . . . . . . . . . . . . . . . . . 579 509 271
Total other non-interest income. . . . . . . . . . . . . . . . . . . . . . . . . . . . . . . . . . . . . . . . . . . . . . . . . 659 608 305
Total non-interest income . . . . . . . . . . . . . . . . . . . . . . . . . . . . . . . . . . . . . . . . . . . . . . . . . . . . . $ 4,579 $ 4,472 $ 4,278
__________
(1) Represents the benefit for mortgage representation and warranty losses recorded in continuing operations. For the total impact to the net benefit for mortgage
representation and warranty losses, including the portion recognized in our consolidated statements of income as a component of discontinued operations,
see “MD&A—Consolidated Balance Sheets Analysis—Table 13: Changes in Representation and Warranty Reserve.”
Non-interest income increased by $107 million to $4.6 billion in 2015 compared to 2014 primarily driven by an increase in
interchange fees due to higher purchase volume in our Credit Card business, partially offset by (i) increased rewards expense due
to a greater proportion of customers with rewards coupled with increased spend on products with higher rewards; and (ii) lower
service charges and other customer-related fees primarily due to the continued run-off of our payment protection products in our
Domestic Card business.
Non-interest income increased by $194 million to $4.5 billion in 2014 compared to 2013. The main drivers included an increase
in net interchange fees due to strong purchase volume in our credit card loan portfolio, partially offset by a decline in our service
charges and other customer-related fees due to strategic choices we made related to our Domestic Card business.
Provision for Credit Losses
Our provision for credit losses in each period is driven by net charge-offs, changes to the allowance for loan and lease losses and
changes to the reserve for unfunded lending commitments. We recorded a provision for credit losses of $4.5 billion in 2015 and
$3.5 billion in both 2014 and 2013. The provision for credit losses as a percentage of net interest income was 24.1%, 19.9% and
19.1% in 2015, 2014 and 2013, respectively.
Our provision for credit losses increased by $995 million in 2015 compared to 2014. The increase was primarily driven by (i) a
larger allowance build in our domestic credit card loan portfolio in 2015 due to continued loan growth coupled with our expectations
for rising charge-off rates, as well as higher charge-offs as new loan balances season; and (ii) a larger build in both the allowance
and reserve for unfunded lending commitments resulting from adverse market conditions impacting our oil and gas portfolio and
taxi medallion lending portfolio in our Commercial Banking business.
The increase in the provision for credit losses of $88 million in 2014 compared to 2013, was primarily driven by a small allowance
build of $68 million in 2014 due to loan growth in our domestic card, auto and commercial portfolios, as compared to a release
of $552 million in 2013 due to an improved credit outlook coupled with improvements in delinquency inventories in our domestic
card portfolio, which were observed in 2014; partially offset by lower net charge-offs of $520 million in 2014 compared to 2013,
mainly due to continued economic improvement and portfolio seasoning in our credit card loan portfolio.
We provide additional information on the provision for credit losses and changes in the allowance for loan and lease losses within
“Credit Risk Profile—Summary of Allowance for Loan and Lease Losses,” “Note 5—Loans” and “Note 6—Allowance for Loan
and Lease Losses.” For information on the allowance methodology for each of our loan categories, see “Note 1—Summary of
Significant Accounting Policies.”