Capital One 2015 Annual Report Download - page 198
Download and view the complete annual report
Please find page 198 of the 2015 Capital One annual report below. You can navigate through the pages in the report by either clicking on the pages listed below, or by using the keyword search tool below to find specific information within the annual report.-
 1
1 -
2
-
3
-
4
-
5
-
6
-
7
-
8
-
9
-
10
-
11
-
12
-
13
-
14
-
15
-
16
-
17
-
18
-
19
-
20
-
21
-
22
-
23
-
24
-
25
-
26
-
27
-
28
-
29
-
30
-
31
-
32
-
33
-
34
-
35
-
36
-
37
-
38
-
39
-
40
-
41
-
42
-
43
-
44
-
45
-
46
-
47
-
48
-
49
-
50
-
51
-
52
-
53
-
54
-
55
-
56
-
57
-
58
-
59
-
60
-
61
-
62
-
63
-
64
-
65
-
66
-
67
-
68
-
69
-
70
-
71
-
72
-
73
-
74
-
75
-
76
-
77
-
78
-
79
-
80
-
81
-
82
-
83
-
84
-
85
-
86
-
87
-
88
-
89
-
90
-
91
-
92
-
93
-
94
-
95
-
96
-
97
-
98
-
99
-
100
-
101
-
102
-
103
-
104
-
105
-
106
-
107
-
108
-
109
-
110
-
111
-
112
-
113
-
114
-
115
-
116
-
117
-
118
-
119
-
120
-
121
-
122
-
123
-
124
-
125
-
126
-
127
-
128
-
129
-
130
-
131
-
132
-
133
-
134
-
135
-
136
-
137
-
138
-
139
-
140
-
141
-
142
-
143
-
144
-
145
-
146
-
147
-
148
-
149
-
150
-
151
-
152
-
153
-
154
-
155
-
156
-
157
-
158
-
159
-
160
-
161
-
162
-
163
-
164
-
165
-
166
-
167
-
168
-
169
-
170
-
171
-
172
-
173
-
174
-
175
-
176
-
177
-
178
-
179
-
180
-
181
-
182
-
183
-
184
-
185
-
186
-
187
-
 188
188 -
 189
189 -
 190
190 -
 191
191 -
 192
192 -
 193
193 -
 194
194 -
 195
195 -
 196
196 -
 197
197 -
 198
198 -
 199
199 -
 200
200 -
 201
201 -
 202
202 -
 203
203 -
 204
204 -
 205
205 -
 206
206 -
 207
207 -
 208
208 -
209
-
210
-
211
-
212
-
213
-
214
-
215
-
216
-
217
-
218
-
219
-
220
-
221
-
222
-
223
-
224
-
225
-
226
-
227
-
228
-
229
-
230
-
231
-
232
-
233
-
234
-
235
-
236
-
237
-
238
-
239
-
240
-
241
-
242
-
243
-
244
-
245
-
246
-
247
-
248
-
249
-
250
-
251
-
252
-
253
 |
 |

CAPITAL ONE FINANCIAL CORPORATION
NOTES TO CONSOLIDATED FINANCIAL STATEMENTS
179 Capital One Financial Corporation (COF)
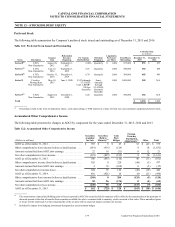
NOTE 12—STOCKHOLDERS' EQUITY
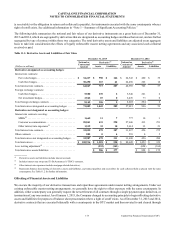
Preferred Stock
The following table summarizes the Company’s preferred stock issued and outstanding as of December 31, 2015 and 2014.
Table 12.1: Preferred Stock Issued and Outstanding
Redeemable
by Issuer
Beginning
Per Annum
Dividend Rate
Dividend
Frequency
Liquidation
Preference
per Share
Carrying Value
(in millions)
Series Description
Issuance
Date
Total Shares
Outstanding
December 31,
2015
December 31,
2014
Series B(1) 6.00%
Non-Cumulative
August 20,
2012
September 1,
2017
6.00% Quarterly $ 1,000 875,000 $ 853 $ 853
Series C(1) 6.25%
Non-Cumulative
June 12,
2014
September 1,
2019
6.25 Quarterly 1,000 500,000 484 484
Series D(1) 6.70%
Non-Cumulative
October 31,
2014
December 1,
2019
6.70 Quarterly 1,000 500,000 485 485
Series E Fixed-to-
Floating Rate
Non-Cumulative
May 14,
2015
June 1, 2020 5.55% through
5/31/2020;
3-mo. LIBOR+
380 bps
thereafter
Semi-
Annually
through
5/31/2020;
Quarterly
thereafter
1,000 1,000,000 988 N/A
Series F(1) 6.20%
Non-Cumulative
August 24,
2015
December 1,
2020
6.20 Quarterly 1,000 500,000 484 N/A
Total $ 3,294 $ 1,822
__________
(1) Ownership is held in the form of depositary shares, each representing a 1/40th interest in a share of fixed-rate non-cumulative perpetual preferred stock.
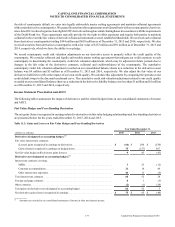
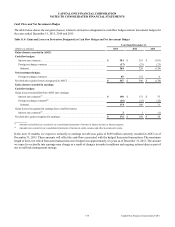
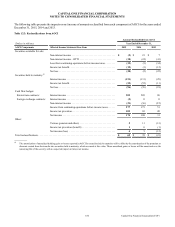
Accumulated Other Comprehensive Income
The following table presents the changes in AOCI by component for the years ended December 31, 2015, 2014 and 2013.
Table 12.2: Accumulated Other Comprehensive Income
(Dollars in millions)
Securities
Available
for Sale
Securities
Held to
Maturity(1)
Cash
Flow
Hedges
Foreign
Currency
Translation
Adjustments(2) Other Total
AOCI as of December 31, 2012 . . . . . . . . . . . . . . . . . . . . . . . . . . . $ 703 $ 0 $ 45 $ 32 $ (41) $ 739
Other comprehensive (loss) income before reclassifications . . . . . (619) (915) (124) 8 18 (1,632)
Amounts reclassified from AOCI into earnings. . . . . . . . . . . . . . . 22 18 (31) 0 12 21
Net other comprehensive (loss) income . . . . . . . . . . . . . . . . . . . . . (597) (897) (155) 8 30 (1,611)
AOCI as of December 31, 2013 . . . . . . . . . . . . . . . . . . . . . . . . . . . 106 (897) (110) 40 (11) (872)
Other comprehensive income (loss) before reclassifications . . . . . 302 0 228 (48) (5) 477
Amounts reclassified from AOCI into earnings. . . . . . . . . . . . . . . 2 76 (108) 0 (5) (35)
Net other comprehensive income (loss) . . . . . . . . . . . . . . . . . . . . . 304 76 120 (48) (10) 442
AOCI as of December 31, 2014 . . . . . . . . . . . . . . . . . . . . . . . . . . . 410 (821) 10 (8) (21) (430)
Other comprehensive (loss) income before reclassifications . . . . . (268) 0 284 (135) (5) (124)
Amounts reclassified from AOCI into earnings. . . . . . . . . . . . . . . 20 96 (174) 0 (4) (62)
Net other comprehensive (loss) income . . . . . . . . . . . . . . . . . . . . . (248) 96 110 (135) (9) (186)
AOCI as of December 31, 2015 . . . . . . . . . . . . . . . . . . . . . . . . . . . $ 162 $ (725) $ 120 $ (143) $ (30) $ (616)
__________
(1) The amortization of unrealized holding gains or losses reported in AOCI for securities held to maturity will be offset by the amortization of the premium or
discount present at the date of transfer from securities available for sale to securities held to maturity, which occurred at fair value. These unrealized gains
or losses will be amortized over the remaining life of the security with no expected impact on future net income.
(2) Includes the impact from hedging instruments designated as net investment hedges.