Capital One 2015 Annual Report Download - page 79
Download and view the complete annual report
Please find page 79 of the 2015 Capital One annual report below. You can navigate through the pages in the report by either clicking on the pages listed below, or by using the keyword search tool below to find specific information within the annual report.-
 1
1 -
2
-
3
-
4
-
5
-
6
-
7
-
8
-
9
-
10
-
11
-
12
-
13
-
14
-
15
-
16
-
17
-
18
-
19
-
20
-
21
-
22
-
23
-
24
-
25
-
26
-
27
-
28
-
29
-
30
-
31
-
32
-
33
-
34
-
35
-
36
-
37
-
38
-
39
-
40
-
41
-
42
-
43
-
44
-
45
-
46
-
47
-
48
-
49
-
50
-
51
-
52
-
53
-
54
-
55
-
56
-
57
-
58
-
59
-
60
-
61
-
62
-
63
-
64
-
65
-
66
-
67
-
68
-
 69
69 -
 70
70 -
 71
71 -
 72
72 -
 73
73 -
 74
74 -
 75
75 -
 76
76 -
 77
77 -
 78
78 -
 79
79 -
 80
80 -
 81
81 -
 82
82 -
 83
83 -
 84
84 -
 85
85 -
 86
86 -
 87
87 -
 88
88 -
 89
89 -
90
-
91
-
92
-
93
-
94
-
95
-
96
-
97
-
98
-
99
-
100
-
101
-
102
-
103
-
104
-
105
-
106
-
107
-
108
-
109
-
110
-
111
-
112
-
113
-
114
-
115
-
116
-
117
-
118
-
119
-
120
-
121
-
122
-
123
-
124
-
125
-
126
-
127
-
128
-
129
-
130
-
131
-
132
-
133
-
134
-
135
-
136
-
137
-
138
-
139
-
140
-
141
-
142
-
143
-
144
-
145
-
146
-
147
-
148
-
149
-
150
-
151
-
152
-
153
-
154
-
155
-
156
-
157
-
158
-
159
-
160
-
161
-
162
-
163
-
164
-
165
-
166
-
167
-
168
-
169
-
170
-
171
-
172
-
173
-
174
-
175
-
176
-
177
-
178
-
179
-
180
-
181
-
182
-
183
-
184
-
185
-
186
-
187
-
188
-
189
-
190
-
191
-
192
-
193
-
194
-
195
-
196
-
197
-
198
-
199
-
200
-
201
-
202
-
203
-
204
-
205
-
206
-
207
-
208
-
209
-
210
-
211
-
212
-
213
-
214
-
215
-
216
-
217
-
218
-
219
-
220
-
221
-
222
-
223
-
224
-
225
-
226
-
227
-
228
-
229
-
230
-
231
-
232
-
233
-
234
-
235
-
236
-
237
-
238
-
239
-
240
-
241
-
242
-
243
-
244
-
245
-
246
-
247
-
248
-
249
-
250
-
251
-
252
-
253
 |
 |

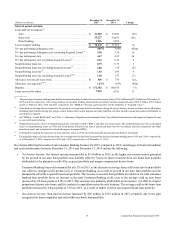
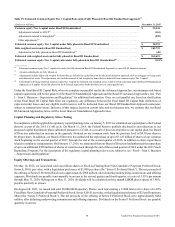
60 Capital One Financial Corporation (COF)
(Dollars in millions)
December 31,
2015
December 31,
2014 Change
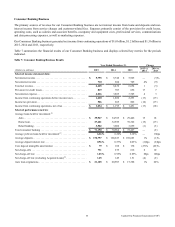
Selected period-end data:
Loans held for investment:(3)
Commercial and multifamily real estate . . . . . . . . . . . . . . . . . . . . . $ 25,518 $ 23,137 10%
Commercial and industrial. . . . . . . . . . . . . . . . . . . . . . . . . . . . . . . . 37,135 26,972 38
Total commercial lending . . . . . . . . . . . . . . . . . . . . . . . . . . . . . . . 62,653 50,109 25
Small-ticket commercial real estate. . . . . . . . . . . . . . . . . . . . . . . . . 613 781 (22)
Total commercial banking. . . . . . . . . . . . . . . . . . . . . . . . . . . . . . . . . . . $ 63,266 $ 50,890 24
Nonperforming loans rate . . . . . . . . . . . . . . . . . . . . . . . . . . . . . . . . . . . 0.87% 0.34% 53bps
Nonperforming asset rate(4) . . . . . . . . . . . . . . . . . . . . . . . . . . . . . . . . . . 0.87 0.36 51
Allowance for loan and lease losses(2) . . . . . . . . . . . . . . . . . . . . . . . . . $ 604 $ 395 53%
Allowance coverage ratio(5) . . . . . . . . . . . . . . . . . . . . . . . . . . . . . . . . . 0.95% 0.78% 17bps
Deposits. . . . . . . . . . . . . . . . . . . . . . . . . . . . . . . . . . . . . . . . . . . . . . . . . $ 34,257 $ 31,954 7%
Loans serviced for others(6) . . . . . . . . . . . . . . . . . . . . . . . . . . . . . . . . . . 17,643 14,131 25
__________
** Change is not meaningful.
(1) The average yield on loans held for investment is calculated by dividing interest income for the period by average loans held for investment during the period.
Interest income excludes various allocations including funds transfer pricing that assigns certain balance sheet assets, deposits and other liabilities and their
related revenue and expenses attributable to each business segment. Some of our tax-related commercial investments generate tax-exempt income or tax
credits. Accordingly, we make certain reclassifications within our Commercial Banking business results to present revenues and yields on a taxable-equivalent
basis, calculated assuming an effective tax rate approximately equal to our federal statutory tax rate of 35%.
(2) The provision for unfunded lending commitments is included in the provision for credit losses in our consolidated statements of income and the related
reserve for unfunded lending commitments is included in other liabilities on our consolidated balance sheets. We recorded a reserve for unfunded lending
commitments of $161 million, $106 million and $80 million as of December 31, 2015, 2014 and 2013, respectively.
(3) The period-end commercial banking loans held for investment include Acquired Loans with carrying value of $958 million and $191 million as of December 31,
2015 and 2014, respectively. The average balance of commercial banking loans held for investment includes Acquired Loans of $215 million, $217 million
and $303 million in 2015, 2014 and 2013, respectively. See “MD&A—Glossary and Acronyms” for the definition of “Acquired Loans.”
(4) Nonperforming assets consist of nonperforming loans, real estate owned (“REO”) and other foreclosed assets. The nonperforming asset rate is calculated
based on nonperforming assets as of the end of the period divided by the sum of period-end loans held for investment, foreclosed properties and other
foreclosed assets, and is adjusted to exclude the impact of acquired REOs.
(5) Calculated by dividing the allowance for loan and lease losses as of the end of the period by period-end loans held for investment.
(6) Represents our portfolio of loans serviced for third parties related to our multifamily finance business.
Key factors affecting the results of our Commercial Banking business for 2015, compared to 2014, and changes in financial
condition and credit performance between December 31, 2015 and December 31, 2014 include the following:
• Net Interest Income: Net interest income increased by $114 million to $1.9 billion in 2015. The increase was due to growth
in commercial and industrial and commercial and multifamily real estate average loans, partially offset by lower loan yields
driven by market and competitive pressures.
• Non-Interest Income: Non-interest income increased by $37 million to $487 million in 2015 primarily driven by increased
revenue from products and services provided to our commercial customers.
• Provision for Credit Losses: The provision for credit losses increased by $209 million to $302 million in 2015. The increase
was primarily driven by a larger build in both the allowance and the reserve for unfunded lending commitments resulting
from adverse market conditions impacting our oil and gas portfolio and taxi medallion lending portfolio. See “MD&A—
Table 17—Commercial Loans by Industry” for additional information about the composition of our commercial banking
loan portfolio, and “Note 5—Loans” for additional information about credit metrics for our commercial banking loan
portfolio.
• Non-Interest Expense: Non-interest expense increased by $73 million to $1.2 billion in 2015, driven by higher operating
expenses due to costs associated with the GE Healthcare acquisition and continued growth in our Commercial Banking
business.
• Loans Held for Investment: Period-end loans held for investment increased by $12.4 billion to $63.3 billion as of
December 31, 2015 from December 31, 2014 driven by the GE Healthcare acquisition as well as growth in our commercial