Capital One 2015 Annual Report Download - page 224
Download and view the complete annual report
Please find page 224 of the 2015 Capital One annual report below. You can navigate through the pages in the report by either clicking on the pages listed below, or by using the keyword search tool below to find specific information within the annual report.-
 1
1 -
2
-
3
-
4
-
5
-
6
-
7
-
8
-
9
-
10
-
11
-
12
-
13
-
14
-
15
-
16
-
17
-
18
-
19
-
20
-
21
-
22
-
23
-
24
-
25
-
26
-
27
-
28
-
29
-
30
-
31
-
32
-
33
-
34
-
35
-
36
-
37
-
38
-
39
-
40
-
41
-
42
-
43
-
44
-
45
-
46
-
47
-
48
-
49
-
50
-
51
-
52
-
53
-
54
-
55
-
56
-
57
-
58
-
59
-
60
-
61
-
62
-
63
-
64
-
65
-
66
-
67
-
68
-
69
-
70
-
71
-
72
-
73
-
74
-
75
-
76
-
77
-
78
-
79
-
80
-
81
-
82
-
83
-
84
-
85
-
86
-
87
-
88
-
89
-
90
-
91
-
92
-
93
-
94
-
95
-
96
-
97
-
98
-
99
-
100
-
101
-
102
-
103
-
104
-
105
-
106
-
107
-
108
-
109
-
110
-
111
-
112
-
113
-
114
-
115
-
116
-
117
-
118
-
119
-
120
-
121
-
122
-
123
-
124
-
125
-
126
-
127
-
128
-
129
-
130
-
131
-
132
-
133
-
134
-
135
-
136
-
137
-
138
-
139
-
140
-
141
-
142
-
143
-
144
-
145
-
146
-
147
-
148
-
149
-
150
-
151
-
152
-
153
-
154
-
155
-
156
-
157
-
158
-
159
-
160
-
161
-
162
-
163
-
164
-
165
-
166
-
167
-
168
-
169
-
170
-
171
-
172
-
173
-
174
-
175
-
176
-
177
-
178
-
179
-
180
-
181
-
182
-
183
-
184
-
185
-
186
-
187
-
188
-
189
-
190
-
191
-
192
-
193
-
194
-
195
-
196
-
197
-
198
-
199
-
200
-
201
-
202
-
203
-
204
-
205
-
206
-
207
-
208
-
209
-
210
-
211
-
212
-
213
-
 214
214 -
 215
215 -
 216
216 -
 217
217 -
 218
218 -
 219
219 -
 220
220 -
 221
221 -
 222
222 -
 223
223 -
 224
224 -
 225
225 -
 226
226 -
 227
227 -
 228
228 -
 229
229 -
 230
230 -
 231
231 -
 232
232 -
 233
233 -
 234
234 -
235
-
236
-
237
-
238
-
239
-
240
-
241
-
242
-
243
-
244
-
245
-
246
-
247
-
248
-
249
-
250
-
251
-
252
-
253
 |
 |

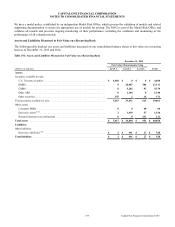
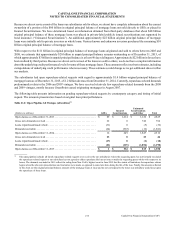
CAPITAL ONE FINANCIAL CORPORATION
NOTES TO CONSOLIDATED FINANCIAL STATEMENTS
205 Capital One Financial Corporation (COF)
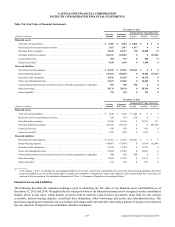
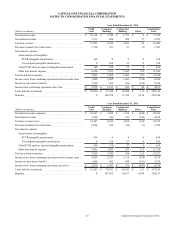
Table 19.6: Fair Value of Financial Instruments
December 31, 2015
Carrying
Amount
Estimated
Fair Value
Estimated Fair Value Hierarchy
(Dollars in millions) Level 1 Level 2 Level 3
Financial assets:
Cash and cash equivalents . . . . . . . . . . . . . . . . . . . . . . . . . . . . . . . . . . . . . . . . . . . . . . . . . . . . $ 8,023 $ 8,023 $ 8,023 $ 0 $ 0
Restricted cash for securitization investors . . . . . . . . . . . . . . . . . . . . . . . . . . . . . . . . . . . . . . . 1,017 1,017 1,017 0 0
Securities held to maturity . . . . . . . . . . . . . . . . . . . . . . . . . . . . . . . . . . . . . . . . . . . . . . . . . . . . 24,619 25,317 198 25,068 51
Net loans held for investment . . . . . . . . . . . . . . . . . . . . . . . . . . . . . . . . . . . . . . . . . . . . . . . . . 224,721 222,007 0 0 222,007
Loans held for sale. . . . . . . . . . . . . . . . . . . . . . . . . . . . . . . . . . . . . . . . . . . . . . . . . . . . . . . . . . 904 933 0 860 73
Interest receivable(1) . . . . . . . . . . . . . . . . . . . . . . . . . . . . . . . . . . . . . . . . . . . . . . . . . . . . . . . . . 1,189 1,189 0 1,189 0
Financial liabilities:
Non-interest bearing deposits . . . . . . . . . . . . . . . . . . . . . . . . . . . . . . . . . . . . . . . . . . . . . . . . . $ 25,847 $ 25,847 $ 25,847 $ 0 $ 0
Interest-bearing deposits . . . . . . . . . . . . . . . . . . . . . . . . . . . . . . . . . . . . . . . . . . . . . . . . . . . . . 191,874 185,075 0 15,848 169,227
Securitized debt obligations. . . . . . . . . . . . . . . . . . . . . . . . . . . . . . . . . . . . . . . . . . . . . . . . . . . 16,166 16,225 0 16,225 0
Senior and subordinated notes . . . . . . . . . . . . . . . . . . . . . . . . . . . . . . . . . . . . . . . . . . . . . . . . . 21,837 22,062 0 22,062 0
Federal funds purchased and securities loaned or sold under agreements to repurchase . . . . 981 981 981 0 0
Other borrowings . . . . . . . . . . . . . . . . . . . . . . . . . . . . . . . . . . . . . . . . . . . . . . . . . . . . . . . . . . . 20,131 20,134 0 20,134 0
Interest payable(1) . . . . . . . . . . . . . . . . . . . . . . . . . . . . . . . . . . . . . . . . . . . . . . . . . . . . . . . . . . . 299 299 0 299 0
December 31, 2014
Carrying
Amount
Estimated
Fair Value
Estimated Fair Value Hierarchy
(Dollars in millions) Level 1 Level 2 Level 3
Financial assets:
Cash and cash equivalents . . . . . . . . . . . . . . . . . . . . . . . . . . . . . . . . . . . . . . . . . . . . . . . . . . . . $ 7,242 $ 7,242 $ 7,242 $ 0 $ 0
Restricted cash for securitization investors . . . . . . . . . . . . . . . . . . . . . . . . . . . . . . . . . . . . . . . 234 234 234 0 0
Securities held to maturity . . . . . . . . . . . . . . . . . . . . . . . . . . . . . . . . . . . . . . . . . . . . . . . . . . . . 22,500 23,634 0 23,503 131
Net loans held for investment . . . . . . . . . . . . . . . . . . . . . . . . . . . . . . . . . . . . . . . . . . . . . . . . . 203,933 207,104 0 0 207,104
Loans held for sale. . . . . . . . . . . . . . . . . . . . . . . . . . . . . . . . . . . . . . . . . . . . . . . . . . . . . . . . . . 626 650 0 650 0
Interest receivable(1) . . . . . . . . . . . . . . . . . . . . . . . . . . . . . . . . . . . . . . . . . . . . . . . . . . . . . . . . . 1,079 1,079 0 1,079 0
Financial liabilities:
Non-interest bearing deposits . . . . . . . . . . . . . . . . . . . . . . . . . . . . . . . . . . . . . . . . . . . . . . . . . $ 25,081 $ 25,081 $ 25,081 $ 0 $ 0
Interest-bearing deposits . . . . . . . . . . . . . . . . . . . . . . . . . . . . . . . . . . . . . . . . . . . . . . . . . . . . . 180,467 174,074 0 11,668 162,406
Securitized debt obligations. . . . . . . . . . . . . . . . . . . . . . . . . . . . . . . . . . . . . . . . . . . . . . . . . . . 11,624 11,745 0 11,745 0
Senior and subordinated notes . . . . . . . . . . . . . . . . . . . . . . . . . . . . . . . . . . . . . . . . . . . . . . . . . 18,684 19,083 0 19,083 0
Federal funds purchased and securities loaned or sold under agreements to repurchase . . . . 880 880 880 0 0
Other borrowings . . . . . . . . . . . . . . . . . . . . . . . . . . . . . . . . . . . . . . . . . . . . . . . . . . . . . . . . . . . 17,269 17,275 0 17,275 0
Interest payable(1) . . . . . . . . . . . . . . . . . . . . . . . . . . . . . . . . . . . . . . . . . . . . . . . . . . . . . . . . . . . 254 254 0 254 0
__________
(1) As of January 1, 2015, we changed our accounting principle to move from a gross basis of presentation to a net basis, for presenting qualifying derivative
assets and liabilities, as well as the related right to reclaim cash collateral or obligation to return cash collateral. Prior period results have been recast to
conform to this presentation. See additional information in “Note 1—Summary of Significant Accounting Policies.”
Financial Assets and Liabilities
The following describes the valuation techniques used in estimating the fair value of our financial assets and liabilities as of
December 31, 2015 and 2014. We applied the fair value provisions to the financial instruments not recognized on the consolidated
balance sheets at fair value, which include securities held to maturity, loans held for investment, loans held for sale, interest
receivable, interest-bearing deposits, securitized debt obligations, other borrowings and senior and subordinated notes. The
provisions requiring us to maximize the use of observable inputs and to measure fair value using a notion of exit price were factored
into our selection of inputs for our established valuation techniques.