Capital One 2015 Annual Report Download - page 219
Download and view the complete annual report
Please find page 219 of the 2015 Capital One annual report below. You can navigate through the pages in the report by either clicking on the pages listed below, or by using the keyword search tool below to find specific information within the annual report.-
 1
1 -
2
-
3
-
4
-
5
-
6
-
7
-
8
-
9
-
10
-
11
-
12
-
13
-
14
-
15
-
16
-
17
-
18
-
19
-
20
-
21
-
22
-
23
-
24
-
25
-
26
-
27
-
28
-
29
-
30
-
31
-
32
-
33
-
34
-
35
-
36
-
37
-
38
-
39
-
40
-
41
-
42
-
43
-
44
-
45
-
46
-
47
-
48
-
49
-
50
-
51
-
52
-
53
-
54
-
55
-
56
-
57
-
58
-
59
-
60
-
61
-
62
-
63
-
64
-
65
-
66
-
67
-
68
-
69
-
70
-
71
-
72
-
73
-
74
-
75
-
76
-
77
-
78
-
79
-
80
-
81
-
82
-
83
-
84
-
85
-
86
-
87
-
88
-
89
-
90
-
91
-
92
-
93
-
94
-
95
-
96
-
97
-
98
-
99
-
100
-
101
-
102
-
103
-
104
-
105
-
106
-
107
-
108
-
109
-
110
-
111
-
112
-
113
-
114
-
115
-
116
-
117
-
118
-
119
-
120
-
121
-
122
-
123
-
124
-
125
-
126
-
127
-
128
-
129
-
130
-
131
-
132
-
133
-
134
-
135
-
136
-
137
-
138
-
139
-
140
-
141
-
142
-
143
-
144
-
145
-
146
-
147
-
148
-
149
-
150
-
151
-
152
-
153
-
154
-
155
-
156
-
157
-
158
-
159
-
160
-
161
-
162
-
163
-
164
-
165
-
166
-
167
-
168
-
169
-
170
-
171
-
172
-
173
-
174
-
175
-
176
-
177
-
178
-
179
-
180
-
181
-
182
-
183
-
184
-
185
-
186
-
187
-
188
-
189
-
190
-
191
-
192
-
193
-
194
-
195
-
196
-
197
-
198
-
199
-
200
-
201
-
202
-
203
-
204
-
205
-
206
-
207
-
208
-
 209
209 -
 210
210 -
 211
211 -
 212
212 -
 213
213 -
 214
214 -
 215
215 -
 216
216 -
 217
217 -
 218
218 -
 219
219 -
 220
220 -
 221
221 -
 222
222 -
 223
223 -
 224
224 -
 225
225 -
 226
226 -
 227
227 -
 228
228 -
 229
229 -
230
-
231
-
232
-
233
-
234
-
235
-
236
-
237
-
238
-
239
-
240
-
241
-
242
-
243
-
244
-
245
-
246
-
247
-
248
-
249
-
250
-
251
-
252
-
253
 |
 |

CAPITAL ONE FINANCIAL CORPORATION
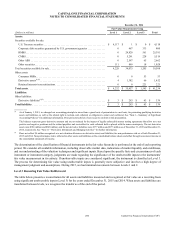
NOTES TO CONSOLIDATED FINANCIAL STATEMENTS
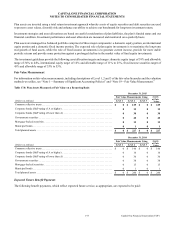
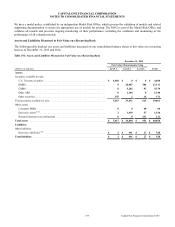
200 Capital One Financial Corporation (COF)
December 31, 2014
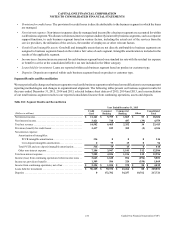
Fair Value Measurements Using
(Dollars in millions) Level 1 Level 2 Level 3 Total
Assets:
Securities available for sale:
U.S. Treasury securities . . . . . . . . . . . . . . . . . . . . . . . . . . . . . . . . . . . . . . . . . . . . . . . . $ 4,117 $ 1 $ 0 $ 4,118
Corporate debt securities guaranteed by U.S. government agencies . . . . . . . . . . . . . . 0 467 333 800
RMBS . . . . . . . . . . . . . . . . . . . . . . . . . . . . . . . . . . . . . . . . . . . . . . . . . . . . . . . . . . . . . . 0 24,820 561 25,381
CMBS . . . . . . . . . . . . . . . . . . . . . . . . . . . . . . . . . . . . . . . . . . . . . . . . . . . . . . . . . . . . . . 0 5,291 228 5,519
Other ABS . . . . . . . . . . . . . . . . . . . . . . . . . . . . . . . . . . . . . . . . . . . . . . . . . . . . . . . . . . 0 2,597 65 2,662
Other securities. . . . . . . . . . . . . . . . . . . . . . . . . . . . . . . . . . . . . . . . . . . . . . . . . . . . . . . 111 899 18 1,028
Total securities available for sale. . . . . . . . . . . . . . . . . . . . . . . . . . . . . . . . . . . . . . . . . . . . 4,228 34,075 1,205 39,508
Other assets:
Consumer MSRs. . . . . . . . . . . . . . . . . . . . . . . . . . . . . . . . . . . . . . . . . . . . . . . . . . . . . . 0 0 53 53
Derivative assets(1)(2) . . . . . . . . . . . . . . . . . . . . . . . . . . . . . . . . . . . . . . . . . . . . . . . . . . . 4 1,382 66 1,452
Retained interests in securitizations . . . . . . . . . . . . . . . . . . . . . . . . . . . . . . . . . . . . . . . 0 0 221 221
Total assets . . . . . . . . . . . . . . . . . . . . . . . . . . . . . . . . . . . . . . . . . . . . . . . . . . . . . . . . . . . . $ 4,232 $ 35,457 $ 1,545 $ 41,234
Liabilities:
Other liabilities:
Derivative liabilities(1)(2) . . . . . . . . . . . . . . . . . . . . . . . . . . . . . . . . . . . . . . . . . . . . . . . . $ 3 $ 293 $ 43 $ 339
Total liabilities . . . . . . . . . . . . . . . . . . . . . . . . . . . . . . . . . . . . . . . . . . . . . . . . . . . . . . . . . $ 3 $ 293 $ 43 $ 339
__________
(1) As of January 1, 2015, we changed our accounting principle to move from a gross basis of presentation to a net basis, for presenting qualifying derivative
assets and liabilities, as well as the related right to reclaim cash collateral or obligation to return cash collateral. See “Note 1—Summary of Significant
Accounting Policies” for additional information. Prior period results have been recast to conform to this presentation.
The balances represent gross derivative amounts and are not reduced by the impact of legally enforceable master netting agreements that allow us to net
positive and negative positions and the related payables and receivables for cash collateral held or placed with the same counterparty. The net derivative
assets were $986 million and $828 million, and the net derivative liabilities were $377 million and $175 million as of December 31, 2015 and December 31,
2014, respectively. See “Note 11—Derivative Instruments and Hedging Activities” for further information.
(2) Does not reflect $4 million recognized as a net valuation allowance on derivative assets and liabilities for non-performance risk as of both December 31,
2015 and 2014. Non-performance risk is reflected in other assets and liabilities on the consolidated balance sheets and offset through non-interest income in
the consolidated statements of income.
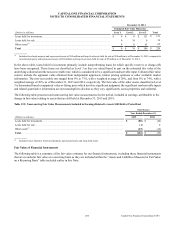
The determination of the classification of financial instruments in the fair value hierarchy is performed at the end of each reporting
period. We consider all available information, including observable market data, indications of market liquidity and orderliness,
and our understanding of the valuation techniques and significant inputs. Based upon the specific facts and circumstances of each
instrument or instrument category, judgments are made regarding the significance of the unobservable inputs to the instruments’
fair value measurement in its entirety. If unobservable inputs are considered significant, the instrument is classified as Level 3.
The process for determining fair value using unobservable inputs is generally more subjective and involves a high degree of
management judgment and assumptions. During 2015, we had minimal movements between Levels 1 and 2.
Level 3 Recurring Fair Value Rollforward
The table below presents a reconciliation for all assets and liabilities measured and recognized at fair value on a recurring basis
using significant unobservable inputs (Level 3) for the years ended December 31, 2015 and 2014. When assets and liabilities are
transferred between levels, we recognize the transfer as of the end of the period.