Capital One 2015 Annual Report Download - page 95
Download and view the complete annual report
Please find page 95 of the 2015 Capital One annual report below. You can navigate through the pages in the report by either clicking on the pages listed below, or by using the keyword search tool below to find specific information within the annual report.-
 1
1 -
2
-
3
-
4
-
5
-
6
-
7
-
8
-
9
-
10
-
11
-
12
-
13
-
14
-
15
-
16
-
17
-
18
-
19
-
20
-
21
-
22
-
23
-
24
-
25
-
26
-
27
-
28
-
29
-
30
-
31
-
32
-
33
-
34
-
35
-
36
-
37
-
38
-
39
-
40
-
41
-
42
-
43
-
44
-
45
-
46
-
47
-
48
-
49
-
50
-
51
-
52
-
53
-
54
-
55
-
56
-
57
-
58
-
59
-
60
-
61
-
62
-
63
-
64
-
65
-
66
-
67
-
68
-
69
-
70
-
71
-
72
-
73
-
74
-
75
-
76
-
77
-
78
-
79
-
80
-
81
-
82
-
83
-
84
-
 85
85 -
 86
86 -
 87
87 -
 88
88 -
 89
89 -
 90
90 -
 91
91 -
 92
92 -
 93
93 -
 94
94 -
 95
95 -
 96
96 -
 97
97 -
 98
98 -
 99
99 -
 100
100 -
 101
101 -
 102
102 -
 103
103 -
 104
104 -
 105
105 -
106
-
107
-
108
-
109
-
110
-
111
-
112
-
113
-
114
-
115
-
116
-
117
-
118
-
119
-
120
-
121
-
122
-
123
-
124
-
125
-
126
-
127
-
128
-
129
-
130
-
131
-
132
-
133
-
134
-
135
-
136
-
137
-
138
-
139
-
140
-
141
-
142
-
143
-
144
-
145
-
146
-
147
-
148
-
149
-
150
-
151
-
152
-
153
-
154
-
155
-
156
-
157
-
158
-
159
-
160
-
161
-
162
-
163
-
164
-
165
-
166
-
167
-
168
-
169
-
170
-
171
-
172
-
173
-
174
-
175
-
176
-
177
-
178
-
179
-
180
-
181
-
182
-
183
-
184
-
185
-
186
-
187
-
188
-
189
-
190
-
191
-
192
-
193
-
194
-
195
-
196
-
197
-
198
-
199
-
200
-
201
-
202
-
203
-
204
-
205
-
206
-
207
-
208
-
209
-
210
-
211
-
212
-
213
-
214
-
215
-
216
-
217
-
218
-
219
-
220
-
221
-
222
-
223
-
224
-
225
-
226
-
227
-
228
-
229
-
230
-
231
-
232
-
233
-
234
-
235
-
236
-
237
-
238
-
239
-
240
-
241
-
242
-
243
-
244
-
245
-
246
-
247
-
248
-
249
-
250
-
251
-
252
-
253
 |
 |

76 Capital One Financial Corporation (COF)
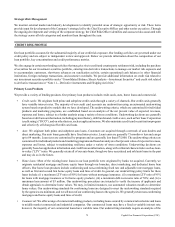
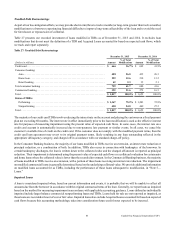
borrower’s financial condition and prospects, as well as an assessment of the industry in which the borrower operates. Where
relevant, we evaluate and appraise underlying collateral and guarantees. We maintain underwriting guidelines and limits
for major types of borrowers and loan products that specify, where applicable, guidelines for debt service coverage, leverage,
LTV ratio and standard covenants and conditions. We assign a risk rating and establish a monitoring schedule for loans
based on the risk profile of the borrower, industry segment, source of repayment, the underlying collateral and guarantees
(if any) and current market conditions. Although we generally retain commercial loans, we may syndicate positions for risk
mitigation purposes (including bridge financing transactions we have underwritten). In addition, we originate and service
multifamily commercial real estate loans which are sold to the GSEs.
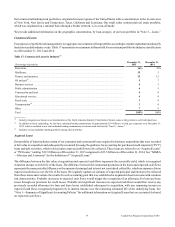
Loans Held for Investment Portfolio Composition
Our loan portfolio consists of loans held for investment, including restricted loans underlying our consolidated securitization trusts
and loans held for sale. Table 16 presents the composition of our portfolio of loans held for investment, including Acquired Loans,
by portfolio segment, as of December 31, 2015 and 2014. Table 16 and the credit metrics presented in this section exclude loans
held for sale, which are carried at lower of cost or fair value and totaled $904 million and $626 million as of December 31, 2015
and 2014, respectively.
Table 16: Loans Held for Investment Portfolio Composition
December 31, 2015 December 31, 2014
(Dollars in millions) Loans
% of
Total Loans
% of
Total
Credit Card:
Domestic credit card(1). . . . . . . . . . . . . . . . . . . . . . . . . . . . . . . . . . . . . . . . . . . . . . . . . . . . $ 87,939 38.2% $ 77,704 37.3%
International credit card. . . . . . . . . . . . . . . . . . . . . . . . . . . . . . . . . . . . . . . . . . . . . . . . . . . 8,186 3.6 8,172 3.9
Total credit card . . . . . . . . . . . . . . . . . . . . . . . . . . . . . . . . . . . . . . . . . . . . . . . . . . . . . . . . . . . 96,125 41.8 85,876 41.2
Consumer Banking:
Auto . . . . . . . . . . . . . . . . . . . . . . . . . . . . . . . . . . . . . . . . . . . . . . . . . . . . . . . . . . . . . . . . . . 41,549 18.1 37,824 18.2
Home loan . . . . . . . . . . . . . . . . . . . . . . . . . . . . . . . . . . . . . . . . . . . . . . . . . . . . . . . . . . . . . 25,227 11.0 30,035 14.4
Retail banking . . . . . . . . . . . . . . . . . . . . . . . . . . . . . . . . . . . . . . . . . . . . . . . . . . . . . . . . . . 3,596 1.5 3,580 1.7
Total consumer banking . . . . . . . . . . . . . . . . . . . . . . . . . . . . . . . . . . . . . . . . . . . . . . . . . . . . . 70,372 30.6 71,439 34.3
Commercial Banking:
Commercial and multifamily real estate . . . . . . . . . . . . . . . . . . . . . . . . . . . . . . . . . . . . . . 25,518 11.1 23,137 11.1
Commercial and industrial . . . . . . . . . . . . . . . . . . . . . . . . . . . . . . . . . . . . . . . . . . . . . . . . 37,135 16.2 26,972 12.9
Total commercial lending . . . . . . . . . . . . . . . . . . . . . . . . . . . . . . . . . . . . . . . . . . . . . . . . 62,653 27.3 50,109 24.0
Small-ticket commercial real estate. . . . . . . . . . . . . . . . . . . . . . . . . . . . . . . . . . . . . . . . . . 613 0.3 781 0.4
Total commercial banking . . . . . . . . . . . . . . . . . . . . . . . . . . . . . . . . . . . . . . . . . . . . . . . . . . . 63,266 27.6 50,890 24.4
Other loans . . . . . . . . . . . . . . . . . . . . . . . . . . . . . . . . . . . . . . . . . . . . . . . . . . . . . . . . . . . . . . . 88 — 111 0.1
Total loans held for investment. . . . . . . . . . . . . . . . . . . . . . . . . . . . . . . . . . . . . . . . . . . . . . . . $ 229,851 100.0% $ 208,316 100.0%
__________
(1) Includes installment loans of $16 million and $144 million as of December 31, 2015 and 2014, respectively.
We market our credit card products throughout the United States, Canada and the United Kingdom. Our credit card loan portfolio
is geographically diversified due to our product and marketing approach, with higher concentrations in California, New York,
Texas, Florida, Illinois, Pennsylvania and Ohio.
Our auto loan portfolio is originated in most regions of the United States with a concentration in Texas, California, Florida, Georgia,
Louisiana, Illinois and Ohio. Our home loan portfolio is concentrated in California, New York, Maryland, Illinois, Virginia, New
Jersey and Florida, which reflects the characteristics of the ING Direct portfolio that comprises the majority of our home loans.
Retail banking includes small business loans and other consumer lending products originated through our branch network with a
concentration in Louisiana, New York, Texas, New Jersey, Maryland and Virginia.