Capital One 2015 Annual Report Download - page 113
Download and view the complete annual report
Please find page 113 of the 2015 Capital One annual report below. You can navigate through the pages in the report by either clicking on the pages listed below, or by using the keyword search tool below to find specific information within the annual report.-
 1
1 -
2
-
3
-
4
-
5
-
6
-
7
-
8
-
9
-
10
-
11
-
12
-
13
-
14
-
15
-
16
-
17
-
18
-
19
-
20
-
21
-
22
-
23
-
24
-
25
-
26
-
27
-
28
-
29
-
30
-
31
-
32
-
33
-
34
-
35
-
36
-
37
-
38
-
39
-
40
-
41
-
42
-
43
-
44
-
45
-
46
-
47
-
48
-
49
-
50
-
51
-
52
-
53
-
54
-
55
-
56
-
57
-
58
-
59
-
60
-
61
-
62
-
63
-
64
-
65
-
66
-
67
-
68
-
69
-
70
-
71
-
72
-
73
-
74
-
75
-
76
-
77
-
78
-
79
-
80
-
81
-
82
-
83
-
84
-
85
-
86
-
87
-
88
-
89
-
90
-
91
-
92
-
93
-
94
-
95
-
96
-
97
-
98
-
99
-
100
-
101
-
102
-
 103
103 -
 104
104 -
 105
105 -
 106
106 -
 107
107 -
 108
108 -
 109
109 -
 110
110 -
 111
111 -
 112
112 -
 113
113 -
 114
114 -
 115
115 -
 116
116 -
 117
117 -
 118
118 -
 119
119 -
 120
120 -
 121
121 -
 122
122 -
 123
123 -
124
-
125
-
126
-
127
-
128
-
129
-
130
-
131
-
132
-
133
-
134
-
135
-
136
-
137
-
138
-
139
-
140
-
141
-
142
-
143
-
144
-
145
-
146
-
147
-
148
-
149
-
150
-
151
-
152
-
153
-
154
-
155
-
156
-
157
-
158
-
159
-
160
-
161
-
162
-
163
-
164
-
165
-
166
-
167
-
168
-
169
-
170
-
171
-
172
-
173
-
174
-
175
-
176
-
177
-
178
-
179
-
180
-
181
-
182
-
183
-
184
-
185
-
186
-
187
-
188
-
189
-
190
-
191
-
192
-
193
-
194
-
195
-
196
-
197
-
198
-
199
-
200
-
201
-
202
-
203
-
204
-
205
-
206
-
207
-
208
-
209
-
210
-
211
-
212
-
213
-
214
-
215
-
216
-
217
-
218
-
219
-
220
-
221
-
222
-
223
-
224
-
225
-
226
-
227
-
228
-
229
-
230
-
231
-
232
-
233
-
234
-
235
-
236
-
237
-
238
-
239
-
240
-
241
-
242
-
243
-
244
-
245
-
246
-
247
-
248
-
249
-
250
-
251
-
252
-
253
 |
 |
94 Capital One Financial Corporation (COF)
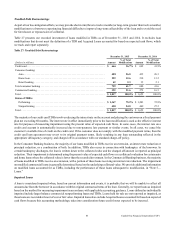
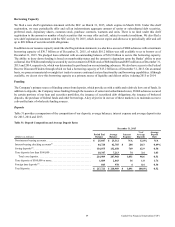
Foreign Exchange Risk
Foreign exchange risk represents exposure to changes in the values of current holdings and future cash flows denominated in other
currencies. Our primary exposure is related to the funding of our non-dollar net investments in our International Card business in
the U.K. and Canada. Changes in foreign exchange rates affect the value of non-dollar denominated equity invested in our foreign
operations and impact our AOCI and related capital ratios. Our intercompany funding exposes our consolidated statements of
income to foreign exchange transaction risk, while our equity investments in our foreign operations results in translation risk in
AOCI. We manage our transaction risk by entering into forward foreign currency derivative contracts to hedge our exposure to
variability in cash flows related to foreign currency denominated intercompany borrowings. In the third quarter of 2014, we began
entering into net investment hedges to manage our AOCI exposure. We apply hedge accounting to both intercompany funding
hedges and net investment hedges.
We measure our total exposure by regularly tracking the equity value of our net equity invested in our U.K. and Canadian operations
as well as their funding requirements. We apply a 30% U.S. dollar appreciation shock against each of our Great British Pound
(“GBP”) and Canadian Dollar (“CAD”) net investment exposures, which we believe approximates a significant adverse foreign
exchange movement over a one-year time horizon. Our gross equity exposures were 1.4 billion GBP and 1.3 billion GBP as of
December 31, 2015 and 2014, respectively, and 686 million CAD and 581 million CAD as of December 31, 2015 and 2014,
respectively. As a result of our derivative management activities, we believe our net exposure to foreign exchange risk is minimal.
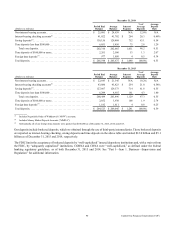
Market Risk Management
We employ several techniques to manage our interest rate and foreign exchange risk, which include, but are not limited to, altering
the duration and re-pricing characteristics of our various assets and liabilities through interest rate derivatives or mitigating the
foreign exchange exposure of certain non-dollar denominated equity or transactions through derivatives. Derivatives are one of
the primary tools we use in managing interest rate and foreign exchange risk. Our current market risk management policies include
the use of derivatives. We execute our derivative contracts in both over-the-counter and exchange-traded derivative markets.
Although the majority of our derivatives are interest rate swaps, we also use a variety of other derivative instruments, including
caps, floors, options, futures and forward contracts, to manage both our interest rate and foreign currency risk. The outstanding
notional amount of our derivative contracts totaled $105.9 billion as of December 31, 2015, compared to $88.6 billion as of
December 31, 2014, driven by an increase in our hedging activities.
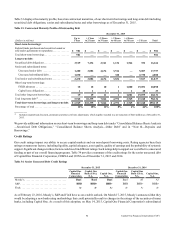
Market Risk Measurement
We have risk management policies and limits established by our market risk management policies and approved by the Board of
Directors. Our objective is to manage our asset and liability risk position and exposure to market risk in accordance with these
policies and prescribed limits based on prevailing market conditions and long-term expectations. Because no single measure can
reflect all aspects of market risk, we use various industry standard market risk measurement techniques and analysis to measure,
assess and manage the impact of changes in interest rates on our net interest income and our economic value of equity and foreign
exchange rates on our non-dollar denominated earnings and non-dollar equity investments in foreign operations. We provide
additional information below in “Economic Value of Equity.”
We consider the impact on both net interest income and economic value of equity in measuring and managing our interest rate
risk. Because the federal funds rate was lowered to near zero in December 2008, remained in a target range of 0% to 0.25% until
December 2015, and then increased to a range of 0.25% to 0.50%, we use a 50 basis points decrease as our declining interest rate
scenario, since a scenario where interest rates would decline by 200 basis points is unlikely. In scenarios where a 50 basis points
decline would result in a rate less than 0%, we assume a rate of 0%. Below we discuss the assumptions used in calculating each
of these measures.
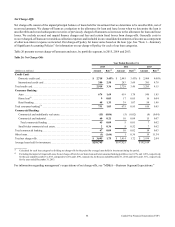
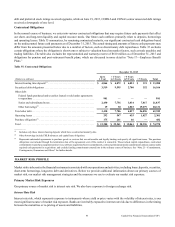
Net Interest Income Sensitivity
This sensitivity measure estimates the impact on our projected 12-month base-line interest rate sensitive revenue resulting from
movements in interest rates. Interest rate sensitive revenue consists of net interest income and certain components of other non-
interest income significantly impacted by movements in interest rates, including changes in the fair value of mortgage servicing
rights and free-standing interest rate swaps. Adjusted net interest income consists of net interest income and changes in the fair
value of mortgage servicing rights, including related derivative hedging activity, and changes in the fair value of free-standing
interest rate swaps. In addition to our existing assets and liabilities, we incorporate expected future business growth assumptions,
such as loan and deposit growth and pricing, and plans for projected changes in our funding mix in our baseline forecast. In