Capital One 2015 Annual Report Download - page 72
Download and view the complete annual report
Please find page 72 of the 2015 Capital One annual report below. You can navigate through the pages in the report by either clicking on the pages listed below, or by using the keyword search tool below to find specific information within the annual report.-
 1
1 -
2
-
3
-
4
-
5
-
6
-
7
-
8
-
9
-
10
-
11
-
12
-
13
-
14
-
15
-
16
-
17
-
18
-
19
-
20
-
21
-
22
-
23
-
24
-
25
-
26
-
27
-
28
-
29
-
30
-
31
-
32
-
33
-
34
-
35
-
36
-
37
-
38
-
39
-
40
-
41
-
42
-
43
-
44
-
45
-
46
-
47
-
48
-
49
-
50
-
51
-
52
-
53
-
54
-
55
-
56
-
57
-
58
-
59
-
60
-
61
-
 62
62 -
 63
63 -
 64
64 -
 65
65 -
 66
66 -
 67
67 -
 68
68 -
 69
69 -
 70
70 -
 71
71 -
 72
72 -
 73
73 -
 74
74 -
 75
75 -
 76
76 -
 77
77 -
 78
78 -
 79
79 -
 80
80 -
 81
81 -
 82
82 -
83
-
84
-
85
-
86
-
87
-
88
-
89
-
90
-
91
-
92
-
93
-
94
-
95
-
96
-
97
-
98
-
99
-
100
-
101
-
102
-
103
-
104
-
105
-
106
-
107
-
108
-
109
-
110
-
111
-
112
-
113
-
114
-
115
-
116
-
117
-
118
-
119
-
120
-
121
-
122
-
123
-
124
-
125
-
126
-
127
-
128
-
129
-
130
-
131
-
132
-
133
-
134
-
135
-
136
-
137
-
138
-
139
-
140
-
141
-
142
-
143
-
144
-
145
-
146
-
147
-
148
-
149
-
150
-
151
-
152
-
153
-
154
-
155
-
156
-
157
-
158
-
159
-
160
-
161
-
162
-
163
-
164
-
165
-
166
-
167
-
168
-
169
-
170
-
171
-
172
-
173
-
174
-
175
-
176
-
177
-
178
-
179
-
180
-
181
-
182
-
183
-
184
-
185
-
186
-
187
-
188
-
189
-
190
-
191
-
192
-
193
-
194
-
195
-
196
-
197
-
198
-
199
-
200
-
201
-
202
-
203
-
204
-
205
-
206
-
207
-
208
-
209
-
210
-
211
-
212
-
213
-
214
-
215
-
216
-
217
-
218
-
219
-
220
-
221
-
222
-
223
-
224
-
225
-
226
-
227
-
228
-
229
-
230
-
231
-
232
-
233
-
234
-
235
-
236
-
237
-
238
-
239
-
240
-
241
-
242
-
243
-
244
-
245
-
246
-
247
-
248
-
249
-
250
-
251
-
252
-
253
 |
 |

53 Capital One Financial Corporation (COF)
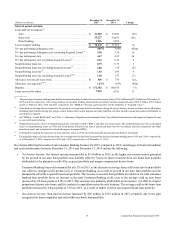
• Non-Interest Expense: Non-interest expense decreased by $376 million to $7.1 billion in 2014. The decrease was largely
due to (i) lower acquisition-related costs; (ii) lower operating expenses driven by the Portfolio Sale; (iii) operating
efficiencies; and (iv) lower provision for litigation matters; partially offset by higher marketing expenses. Non-interest
expense also included PCCR intangible amortization of $369 million in 2014.
• Loans Held for Investment: Period-end loans held for investment increased by $4.6 billion to $85.9 billion as of December 31,
2014 from December 31, 2013. This increase was primarily driven by growth in the domestic card loan portfolio. Average
loans held for investment decreased by $261 million to $78.9 billion in 2014 compared to 2013, due to the run-off of certain
loans acquired in the 2012 U.S. card acquisition, as well as the Portfolio Sale in 2013, partially offset by growth in the
second half of 2014.
• Net Charge-off and Delinquency Statistics: The net charge-off rate decreased by 69 basis points to 3.46% in 2014 compared
to 2013, largely due to continued economic improvement and portfolio seasoning. The 30+ day delinquency rate decreased
by 24 basis points to 3.30% as of December 31, 2014 from December 31, 2013, due to lower delinquency inventories.
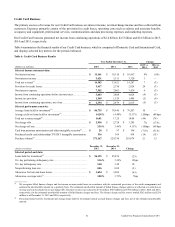
Domestic Card Business
Domestic Card generated net income from continuing operations of $2.2 billion in both 2015 and 2014, and $2.4 billion in 2013.
Domestic Card accounted for 91% of total net revenues of our Credit Card business in 2015, compared to 90% in both 2014 and
2013. Income attributable to Domestic Card represented 95% of net income of our Credit Card business in 2015, compared to
90% and 91% in 2014 and 2013, respectively. The higher portion of total net revenue attributable to Domestic Card was primarily
due to strong loan growth in our Domestic business, the impact of foreign exchange rates driven by the strengthening of the U.S.
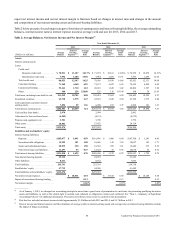
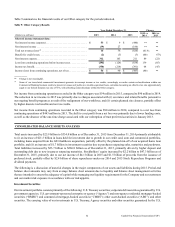
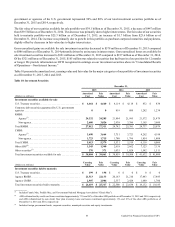
dollar, as well as the build in our U.K. PPI Reserve in our International Card business.Table 6.1 summarizes the financial results
for Domestic Card and displays selected key metrics for the periods indicated.
Table 6.1: Domestic Card Business Results
Year Ended December 31, Change
(Dollars in millions) 2015 2014 2013 2015 vs.
2014
2014 vs.
2013
Selected income statement data:
Net interest income . . . . . . . . . . . . . . . . . . . . . . . . . . . . . . . . . . . . . . . $ 10,147 $ 9,241 $ 9,887 10% (7)%
Non-interest income. . . . . . . . . . . . . . . . . . . . . . . . . . . . . . . . . . . . . . . 3,183 3,001 2,957 6 1
Total net revenue(1) . . . . . . . . . . . . . . . . . . . . . . . . . . . . . . . . . . . . . . . . 13,330 12,242 12,844 9 (5)
Provision for credit losses . . . . . . . . . . . . . . . . . . . . . . . . . . . . . . . . . . 3,204 2,493 2,502 29 —
Non-interest expense . . . . . . . . . . . . . . . . . . . . . . . . . . . . . . . . . . . . . . 6,627 6,264 6,645 6 (6)
Income from continuing operations before income taxes . . . . . . . . . . 3,499 3,485 3,697 — (6)
Income tax provision . . . . . . . . . . . . . . . . . . . . . . . . . . . . . . . . . . . . . . 1,267 1,246 1,316 2 (5)
Income from continuing operations, net of tax . . . . . . . . . . . . . . . . . . $ 2,232 $ 2,239 $ 2,381 — (6)
Selected performance metrics:
Average loans held for investment(2) . . . . . . . . . . . . . . . . . . . . . . . . . . $ 78,743 $ 71,262 $ 71,234 10 —
Average yield on loans held for investment(3) . . . . . . . . . . . . . . . . . . . 14.21% 14.26% 15.27% (5)bps (101)bps
Total net revenue margin(4). . . . . . . . . . . . . . . . . . . . . . . . . . . . . . . . . . 16.93 17.18 18.03 (25) (85)
Net charge-offs. . . . . . . . . . . . . . . . . . . . . . . . . . . . . . . . . . . . . . . . . . . $ 2,718 $ 2,445 $ 2,904 11% (16)%
Net charge-off rate . . . . . . . . . . . . . . . . . . . . . . . . . . . . . . . . . . . . . . . . 3.45% 3.43% 4.08% 2bps (65)bps
Card loan premium amortization and other intangible accretion(5) . . . $ 28 $ 97 $ 198 (71)% (51)%
PCCR intangible amortization . . . . . . . . . . . . . . . . . . . . . . . . . . . . . . . 316 369 434 (14) (15)
Purchase volume(6) . . . . . . . . . . . . . . . . . . . . . . . . . . . . . . . . . . . . . . . . 246,740 208,716 186,901 18 12