Capital One 2015 Annual Report Download - page 177
Download and view the complete annual report
Please find page 177 of the 2015 Capital One annual report below. You can navigate through the pages in the report by either clicking on the pages listed below, or by using the keyword search tool below to find specific information within the annual report.-
 1
1 -
2
-
3
-
4
-
5
-
6
-
7
-
8
-
9
-
10
-
11
-
12
-
13
-
14
-
15
-
16
-
17
-
18
-
19
-
20
-
21
-
22
-
23
-
24
-
25
-
26
-
27
-
28
-
29
-
30
-
31
-
32
-
33
-
34
-
35
-
36
-
37
-
38
-
39
-
40
-
41
-
42
-
43
-
44
-
45
-
46
-
47
-
48
-
49
-
50
-
51
-
52
-
53
-
54
-
55
-
56
-
57
-
58
-
59
-
60
-
61
-
62
-
63
-
64
-
65
-
66
-
67
-
68
-
69
-
70
-
71
-
72
-
73
-
74
-
75
-
76
-
77
-
78
-
79
-
80
-
81
-
82
-
83
-
84
-
85
-
86
-
87
-
88
-
89
-
90
-
91
-
92
-
93
-
94
-
95
-
96
-
97
-
98
-
99
-
100
-
101
-
102
-
103
-
104
-
105
-
106
-
107
-
108
-
109
-
110
-
111
-
112
-
113
-
114
-
115
-
116
-
117
-
118
-
119
-
120
-
121
-
122
-
123
-
124
-
125
-
126
-
127
-
128
-
129
-
130
-
131
-
132
-
133
-
134
-
135
-
136
-
137
-
138
-
139
-
140
-
141
-
142
-
143
-
144
-
145
-
146
-
147
-
148
-
149
-
150
-
151
-
152
-
153
-
154
-
155
-
156
-
157
-
158
-
159
-
160
-
161
-
162
-
163
-
164
-
165
-
166
-
 167
167 -
 168
168 -
 169
169 -
 170
170 -
 171
171 -
 172
172 -
 173
173 -
 174
174 -
 175
175 -
 176
176 -
 177
177 -
 178
178 -
 179
179 -
 180
180 -
 181
181 -
 182
182 -
 183
183 -
 184
184 -
 185
185 -
 186
186 -
 187
187 -
188
-
189
-
190
-
191
-
192
-
193
-
194
-
195
-
196
-
197
-
198
-
199
-
200
-
201
-
202
-
203
-
204
-
205
-
206
-
207
-
208
-
209
-
210
-
211
-
212
-
213
-
214
-
215
-
216
-
217
-
218
-
219
-
220
-
221
-
222
-
223
-
224
-
225
-
226
-
227
-
228
-
229
-
230
-
231
-
232
-
233
-
234
-
235
-
236
-
237
-
238
-
239
-
240
-
241
-
242
-
243
-
244
-
245
-
246
-
247
-
248
-
249
-
250
-
251
-
252
-
253
 |
 |

CAPITAL ONE FINANCIAL CORPORATION
NOTES TO CONSOLIDATED FINANCIAL STATEMENTS
158 Capital One Financial Corporation (COF)
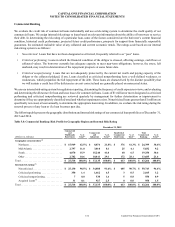
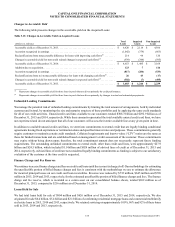
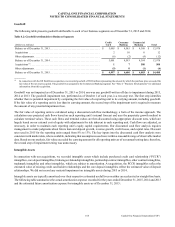
Changes in Accretable Yield
The following table presents changes in the accretable yield on the Acquired Loans:
Table 5.13: Changes in Accretable Yield on Acquired Loans
(Dollars in millions)
Total
Loans
Impaired
Loans
Non-Impaired
Loans
Accretable yield as of December 31, 2013. . . . . . . . . . . . . . . . . . . . . . . . . . . . . . . . . . . . . . . . . . . . $ 6,420 $ 2,114 $ 4,306
Accretion recognized in earnings . . . . . . . . . . . . . . . . . . . . . . . . . . . . . . . . . . . . . . . . . . . . . . . . . . . (1,042) (379) (663)
Reclassifications from nonaccretable difference for loans with improving cash flows(1) . . . . . . . . 214 94 120
Changes in accretable yield for non-credit related changes in expected cash flows(2) . . . . . . . . . . . (939) (344) (595)
Accretable yield as of December 31, 2014. . . . . . . . . . . . . . . . . . . . . . . . . . . . . . . . . . . . . . . . . . . . $ 4,653 $ 1,485 $ 3,168
Addition due to acquisition. . . . . . . . . . . . . . . . . . . . . . . . . . . . . . . . . . . . . . . . . . . . . . . . . . . . . . . . 123 7 116
Accretion recognized in earnings . . . . . . . . . . . . . . . . . . . . . . . . . . . . . . . . . . . . . . . . . . . . . . . . . . . (817) (284) (533)
Reclassifications from (to) nonaccretable difference for loans with changing cash flows(1) . . . . . . 26 43 (17)
Changes in accretable yield for non-credit related changes in expected cash flows(2) . . . . . . . . . . . (502) (7) (495)
Accretable yield as of December 31, 2015. . . . . . . . . . . . . . . . . . . . . . . . . . . . . . . . . . . . . . . . . . . . $ 3,483 $ 1,244 $ 2,239
__________
(1) Represents changes in accretable yield for those loans in pools that are driven primarily by credit performance.
(2) Represents changes in accretable yield for those loans in pools that are driven primarily by changes in actual and estimated prepayments.
Unfunded Lending Commitments
We manage the potential risk of unfunded lending commitments by limiting the total amount of arrangements, both by individual
customer and in total, by monitoring the size and maturity structure of these portfolios and by applying the same credit standards
for all of our credit activities. Unused credit card lines available to our customers totaled $308.3 billion and $292.9 billion as of
December 31, 2015 and 2014, respectively. While these amounts represented the total available unused credit card lines, we have
not experienced and do not anticipate that all of our customers will access their entire available line at any given point in time.
In addition to available unused credit card lines, we enter into commitments to extend credit that are legally binding conditional
agreements having fixed expirations or termination dates and specified interest rates and purposes. These commitments generally
require customers to maintain certain credit standards. Collateral requirements and loan-to-value (“LTV”) ratios are the same as
those for funded transactions and are established based on management’s credit assessment of the customer. These commitments
may expire without being drawn upon; therefore, the total commitment amount does not necessarily represent future funding
requirements. The outstanding unfunded commitments to extend credit, other than credit card lines, were approximately $27.9
billion and $24.5 billion, which included $1.0 billion and $924 million of advised lines of credit as of December 31, 2015 and
2014, respectively. Advised lines of credit are not considered legally binding commitments as funding is subject to our satisfactory
evaluation of the customer at the time credit is requested.
Finance Charge and Fee Reserves
We continue to accrue finance charges and fees on credit card loans until the account is charged-off. Our methodology for estimating
the uncollectible portion of billed finance charges and fees is consistent with the methodology we use to estimate the allowance
for incurred principal losses on our credit card loan receivables. Revenue was reduced by $732 million, $645 million and $796
million in 2015, 2014 and 2013, respectively, for the estimated uncollectible portion of billed finance charges and fees. The finance
charge and fee reserve, which is recorded as a contra asset on our consolidated balance sheets, totaled $262 million as of
December 31, 2015, compared to $216 million as of December 31, 2014.
Loans Held for Sale
We had total loans held for sale of $904 million and $626 million as of December 31, 2015 and 2014, respectively. We also
originated for sale $6.4 billion, $5.4 billion and $2.1 billion of conforming residential mortgage loans and commercial multifamily
real estate loans in 2015, 2014 and 2013, respectively. We retained servicing on approximately 100%, 96% and 92% of these loans
sold in 2015, 2014 and 2013, respectively.