Capital One 2015 Annual Report Download - page 66
Download and view the complete annual report
Please find page 66 of the 2015 Capital One annual report below. You can navigate through the pages in the report by either clicking on the pages listed below, or by using the keyword search tool below to find specific information within the annual report.-
 1
1 -
2
-
3
-
4
-
5
-
6
-
7
-
8
-
9
-
10
-
11
-
12
-
13
-
14
-
15
-
16
-
17
-
18
-
19
-
20
-
21
-
22
-
23
-
24
-
25
-
26
-
27
-
28
-
29
-
30
-
31
-
32
-
33
-
34
-
35
-
36
-
37
-
38
-
39
-
40
-
41
-
42
-
43
-
44
-
45
-
46
-
47
-
48
-
49
-
50
-
51
-
52
-
53
-
54
-
55
-
 56
56 -
 57
57 -
 58
58 -
 59
59 -
 60
60 -
 61
61 -
 62
62 -
 63
63 -
 64
64 -
 65
65 -
 66
66 -
 67
67 -
 68
68 -
 69
69 -
 70
70 -
 71
71 -
 72
72 -
 73
73 -
 74
74 -
 75
75 -
 76
76 -
77
-
78
-
79
-
80
-
81
-
82
-
83
-
84
-
85
-
86
-
87
-
88
-
89
-
90
-
91
-
92
-
93
-
94
-
95
-
96
-
97
-
98
-
99
-
100
-
101
-
102
-
103
-
104
-
105
-
106
-
107
-
108
-
109
-
110
-
111
-
112
-
113
-
114
-
115
-
116
-
117
-
118
-
119
-
120
-
121
-
122
-
123
-
124
-
125
-
126
-
127
-
128
-
129
-
130
-
131
-
132
-
133
-
134
-
135
-
136
-
137
-
138
-
139
-
140
-
141
-
142
-
143
-
144
-
145
-
146
-
147
-
148
-
149
-
150
-
151
-
152
-
153
-
154
-
155
-
156
-
157
-
158
-
159
-
160
-
161
-
162
-
163
-
164
-
165
-
166
-
167
-
168
-
169
-
170
-
171
-
172
-
173
-
174
-
175
-
176
-
177
-
178
-
179
-
180
-
181
-
182
-
183
-
184
-
185
-
186
-
187
-
188
-
189
-
190
-
191
-
192
-
193
-
194
-
195
-
196
-
197
-
198
-
199
-
200
-
201
-
202
-
203
-
204
-
205
-
206
-
207
-
208
-
209
-
210
-
211
-
212
-
213
-
214
-
215
-
216
-
217
-
218
-
219
-
220
-
221
-
222
-
223
-
224
-
225
-
226
-
227
-
228
-
229
-
230
-
231
-
232
-
233
-
234
-
235
-
236
-
237
-
238
-
239
-
240
-
241
-
242
-
243
-
244
-
245
-
246
-
247
-
248
-
249
-
250
-
251
-
252
-
253
 |
 |

47 Capital One Financial Corporation (COF)
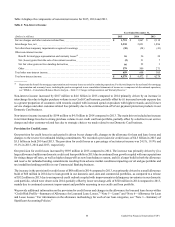
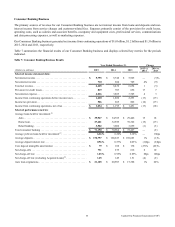
Net interest income increased by $1.0 billion to $18.8 billion in 2015 compared to 2014. The increase was primarily driven by
growth in our credit card and commercial loan portfolios, as well as our auto loan portfolio in our Consumer Banking business.
Net interest margin decreased by 1 basis point to 6.66% in 2015 compared to 2014. The relatively consistent net interest margin
reflected continued growth in our domestic card loan portfolio and the planned run-off of the acquired home loan portfolio in our
Consumer Banking business, as well as lower wholesale funding costs; offset by the impact of declining yields in our auto,
commercial, credit card and investment securities portfolios. The lower yield in the international credit card loan portfolio also
reflected the impact from the build in the U.K. PPI Reserve in the second and third quarters of 2015.
Net interest income decreased by $288 million to $17.8 billion in 2014 compared to 2013. The decrease was primarily driven by
the Portfolio Sale in 2013, partially offset by growth in commercial, auto and credit card loan portfolios, lower funding costs and
higher yielding investment securities in 2014. Net interest margin decreased by 13 basis points to 6.67% in 2014 compared to
2013. The decrease was primarily due to lower average loan yields driven by the Portfolio Sale in 2013 and a shift in the mix of
the loan portfolio to lower yielding commercial and auto loans, partially offset by a reduction in our cost of funds and higher
yielding investment securities.
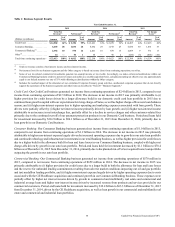
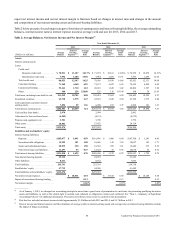
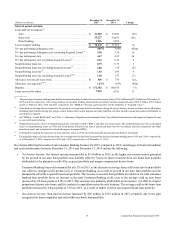
Table 3 displays the change in our net interest income between periods and the extent to which the variance is attributable to
(i) changes in the volume of our interest-earning assets and interest-bearing liabilities; or (ii) changes in the interest rates related
to these assets and liabilities.
Table 3: Rate/Volume Analysis of Net Interest Income(1)
2015 vs. 2014 2014 vs. 2013
(Dollars in millions)
Total
Variance Volume Rate
Total
Variance Volume Rate
Interest income:
Loans:
Credit card . . . . . . . . . . . . . . . . . . . . . . . . . . . . . . . . . . . . . . . . . . . . $ 957 $ 1,135 $ (178) $ (741) $ (576) $ (165)
Consumer banking . . . . . . . . . . . . . . . . . . . . . . . . . . . . . . . . . . . . . . 13 15 (2) 19 (93) 112
Commercial banking . . . . . . . . . . . . . . . . . . . . . . . . . . . . . . . . . . . . 61 159 (98) 62 251 (189)
Other. . . . . . . . . . . . . . . . . . . . . . . . . . . . . . . . . . . . . . . . . . . . . . . . . 92 (28) 120 100 (9) 109
Total loans, including loans held for sale . . . . . . . . . . . . . . . . . . . . . . . 1,123 1,281 (158) (560) (427) (133)
Investment securities . . . . . . . . . . . . . . . . . . . . . . . . . . . . . . . . . . . . . . . (53) 30 (83) 53 (24) 77
Cash equivalents and other interest-earning assets . . . . . . . . . . . . . . . . (8) 15 (23) 6 (1) 7
Total interest income . . . . . . . . . . . . . . . . . . . . . . . . . . . . . . . . . . . . . . . 1,062 1,326 (264) (501) (452) (49)
Interest expense:
Deposits . . . . . . . . . . . . . . . . . . . . . . . . . . . . . . . . . . . . . . . . . . . . . . 3 27 (24) (153) (43) (110)
Securitized debt obligations . . . . . . . . . . . . . . . . . . . . . . . . . . . . . . . 6 35 (29) (38) — (38)
Senior and subordinated notes . . . . . . . . . . . . . . . . . . . . . . . . . . . . . 31 70 (39) (16) 74 (90)
Other borrowings and liabilities. . . . . . . . . . . . . . . . . . . . . . . . . . . . 6 (4) 10 (6) (8) 2
Total interest expense . . . . . . . . . . . . . . . . . . . . . . . . . . . . . . . . . . . . . . 46 128 (82) (213) 23 (236)
Net interest income . . . . . . . . . . . . . . . . . . . . . . . . . . . . . . . . . . . . . . . $ 1,016 $ 1,198 $ (182) $ (288) $ (475) $ 187
__________
(1) We calculate the change in interest income and interest expense separately for each item. The portion of interest income or interest expense attributable to
both volume and rate is allocated proportionately when the calculation results in a positive value. When the portion of interest income or interest expense
attributable to both volume and rate results in a negative value, the total amount is allocated to volume or rate, depending on which amount is positive.
Non-Interest Income
Non-interest income primarily consists of interchange income net of rewards expense, service charges and other customer-related
fees, and other non-interest income. Other non-interest income includes the pre-tax net benefit for mortgage representation and
warranty losses related to continuing operations, gains and losses from the sale of investment securities, gains and losses on
derivatives not accounted for in hedge accounting relationships, and hedge ineffectiveness.