Capital One 2015 Annual Report Download - page 175
Download and view the complete annual report
Please find page 175 of the 2015 Capital One annual report below. You can navigate through the pages in the report by either clicking on the pages listed below, or by using the keyword search tool below to find specific information within the annual report.-
 1
1 -
2
-
3
-
4
-
5
-
6
-
7
-
8
-
9
-
10
-
11
-
12
-
13
-
14
-
15
-
16
-
17
-
18
-
19
-
20
-
21
-
22
-
23
-
24
-
25
-
26
-
27
-
28
-
29
-
30
-
31
-
32
-
33
-
34
-
35
-
36
-
37
-
38
-
39
-
40
-
41
-
42
-
43
-
44
-
45
-
46
-
47
-
48
-
49
-
50
-
51
-
52
-
53
-
54
-
55
-
56
-
57
-
58
-
59
-
60
-
61
-
62
-
63
-
64
-
65
-
66
-
67
-
68
-
69
-
70
-
71
-
72
-
73
-
74
-
75
-
76
-
77
-
78
-
79
-
80
-
81
-
82
-
83
-
84
-
85
-
86
-
87
-
88
-
89
-
90
-
91
-
92
-
93
-
94
-
95
-
96
-
97
-
98
-
99
-
100
-
101
-
102
-
103
-
104
-
105
-
106
-
107
-
108
-
109
-
110
-
111
-
112
-
113
-
114
-
115
-
116
-
117
-
118
-
119
-
120
-
121
-
122
-
123
-
124
-
125
-
126
-
127
-
128
-
129
-
130
-
131
-
132
-
133
-
134
-
135
-
136
-
137
-
138
-
139
-
140
-
141
-
142
-
143
-
144
-
145
-
146
-
147
-
148
-
149
-
150
-
151
-
152
-
153
-
154
-
155
-
156
-
157
-
158
-
159
-
160
-
161
-
162
-
163
-
164
-
 165
165 -
 166
166 -
 167
167 -
 168
168 -
 169
169 -
 170
170 -
 171
171 -
 172
172 -
 173
173 -
 174
174 -
 175
175 -
 176
176 -
 177
177 -
 178
178 -
 179
179 -
 180
180 -
 181
181 -
 182
182 -
 183
183 -
 184
184 -
 185
185 -
186
-
187
-
188
-
189
-
190
-
191
-
192
-
193
-
194
-
195
-
196
-
197
-
198
-
199
-
200
-
201
-
202
-
203
-
204
-
205
-
206
-
207
-
208
-
209
-
210
-
211
-
212
-
213
-
214
-
215
-
216
-
217
-
218
-
219
-
220
-
221
-
222
-
223
-
224
-
225
-
226
-
227
-
228
-
229
-
230
-
231
-
232
-
233
-
234
-
235
-
236
-
237
-
238
-
239
-
240
-
241
-
242
-
243
-
244
-
245
-
246
-
247
-
248
-
249
-
250
-
251
-
252
-
253
 |
 |

CAPITAL ONE FINANCIAL CORPORATION
NOTES TO CONSOLIDATED FINANCIAL STATEMENTS
156 Capital One Financial Corporation (COF)
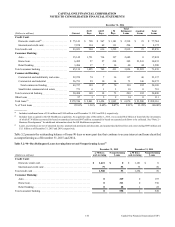
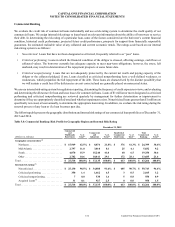
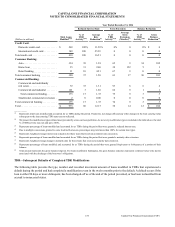
Total Loans
Modified(1)(2)
Year Ended December 31, 2014
Reduced Interest Rate Term Extension Balance Reduction
(Dollars in millions)
% of
TDR
Activity(3)(4)
Average
Rate
Reduction(5)
% of
TDR
Activity(4)(6)
Average
Term
Extension
(Months)(7)
% of
TDR
Activity(4)(8)
Gross
Balance
Reduction(9)
Credit Card:
Domestic credit card . . . . . . . . . . . . . $ 269 100% 11.59% 0% 0 0% $ 0
International credit card . . . . . . . . . . 149 100 25.39 0 0 0 0
Total credit card . . . . . . . . . . . . . . . . . . . 418 100 16.51 0 0 0 0
Consumer Banking:
Auto. . . . . . . . . . . . . . . . . . . . . . . . . . 334 39 1.38 65 9 34 102
Home loan. . . . . . . . . . . . . . . . . . . . . 35 31 2.60 38 152 5 1
Retail banking . . . . . . . . . . . . . . . . . . 11 10 4.21 67 9 0 0
Total consumer banking . . . . . . . . . . . . . 380 37 1.50 63 17 30 103
Commercial Banking:
Commercial and multifamily
real estate. . . . . . . . . . . . . . . . . . . . . . 72 35 1.31 93 8 6 2
Commercial and industrial . . . . . . . . 101 3 1.66 62 9 1 1
Total commercial lending. . . . . . . . 173 17 1.35 75 9 3 3
Small-ticket commercial real estate .2 0 0.00 0 0 0 0
Total commercial banking . . . . . . . . . . . 175 17 1.35 74 9 3 3
Total . . . . . . . . . . . . . . . . . . . . . . . . . . . . $ 973 60 12.17 38 14 12 $ 106
__________
(1) Represents total loans modified and accounted for as TDRs during the period. Paydowns, net charge-offs and any other changes in the loan carrying value
subsequent to the loan entering TDR status are not reflected.
(2) We present the modification types utilized most prevalently across our loan portfolios. As not every modification type is included in the table above, the total
% of TDR activity may not add up to 100%.
(3) Represents percentage of loans modified and accounted for as TDRs during the period that were granted a reduced interest rate.
(4) Due to multiple concessions granted to some troubled borrowers, percentages may total more than 100% for certain loan types.
(5) Represents weighted average interest rate reduction for those loans that received an interest rate concession.
(6) Represents percentage of loans modified and accounted for as TDRs during the period that were granted a maturity date extension.
(7) Represents weighted average change in maturity date for those loans that received a maturity date extension.
(8) Represents percentage of loans modified and accounted for as TDRs during the period that were granted forgiveness or forbearance of a portion of their
balance.
(9) Total amount represents the gross balance forgiven. For loans modified in bankruptcy, the gross balance reduction represents collateral value write downs
associated with the discharge of the borrower’s obligations.
TDR—Subsequent Defaults of Completed TDR Modifications
The following table presents the type, number and recorded investment amount of loans modified in TDRs that experienced a
default during the period and had completed a modification event in the twelve months prior to the default. A default occurs if the
loan is either 90 days or more delinquent, has been charged-off as of the end of the period presented, or has been reclassified from
accrual to nonaccrual status.