Capital One 2015 Annual Report Download - page 102
Download and view the complete annual report
Please find page 102 of the 2015 Capital One annual report below. You can navigate through the pages in the report by either clicking on the pages listed below, or by using the keyword search tool below to find specific information within the annual report.-
 1
1 -
2
-
3
-
4
-
5
-
6
-
7
-
8
-
9
-
10
-
11
-
12
-
13
-
14
-
15
-
16
-
17
-
18
-
19
-
20
-
21
-
22
-
23
-
24
-
25
-
26
-
27
-
28
-
29
-
30
-
31
-
32
-
33
-
34
-
35
-
36
-
37
-
38
-
39
-
40
-
41
-
42
-
43
-
44
-
45
-
46
-
47
-
48
-
49
-
50
-
51
-
52
-
53
-
54
-
55
-
56
-
57
-
58
-
59
-
60
-
61
-
62
-
63
-
64
-
65
-
66
-
67
-
68
-
69
-
70
-
71
-
72
-
73
-
74
-
75
-
76
-
77
-
78
-
79
-
80
-
81
-
82
-
83
-
84
-
85
-
86
-
87
-
88
-
89
-
90
-
91
-
 92
92 -
 93
93 -
 94
94 -
 95
95 -
 96
96 -
 97
97 -
 98
98 -
 99
99 -
 100
100 -
 101
101 -
 102
102 -
 103
103 -
 104
104 -
 105
105 -
 106
106 -
 107
107 -
 108
108 -
 109
109 -
 110
110 -
 111
111 -
 112
112 -
113
-
114
-
115
-
116
-
117
-
118
-
119
-
120
-
121
-
122
-
123
-
124
-
125
-
126
-
127
-
128
-
129
-
130
-
131
-
132
-
133
-
134
-
135
-
136
-
137
-
138
-
139
-
140
-
141
-
142
-
143
-
144
-
145
-
146
-
147
-
148
-
149
-
150
-
151
-
152
-
153
-
154
-
155
-
156
-
157
-
158
-
159
-
160
-
161
-
162
-
163
-
164
-
165
-
166
-
167
-
168
-
169
-
170
-
171
-
172
-
173
-
174
-
175
-
176
-
177
-
178
-
179
-
180
-
181
-
182
-
183
-
184
-
185
-
186
-
187
-
188
-
189
-
190
-
191
-
192
-
193
-
194
-
195
-
196
-
197
-
198
-
199
-
200
-
201
-
202
-
203
-
204
-
205
-
206
-
207
-
208
-
209
-
210
-
211
-
212
-
213
-
214
-
215
-
216
-
217
-
218
-
219
-
220
-
221
-
222
-
223
-
224
-
225
-
226
-
227
-
228
-
229
-
230
-
231
-
232
-
233
-
234
-
235
-
236
-
237
-
238
-
239
-
240
-
241
-
242
-
243
-
244
-
245
-
246
-
247
-
248
-
249
-
250
-
251
-
252
-
253
 |
 |

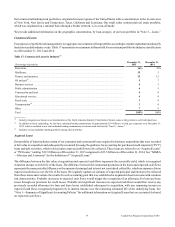
83 Capital One Financial Corporation (COF)
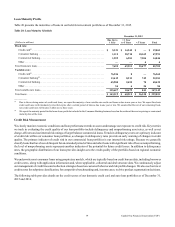
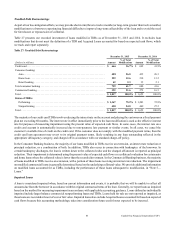
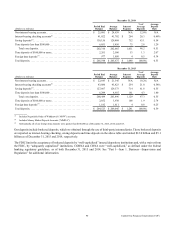
Table 25: Nonperforming Loans and Other Nonperforming Assets(1)
December 31, 2015 December 31, 2014
(Dollars in millions) Amount
% of Total
Loans HFI Amount
% of Total
Loans HFI
Nonperforming loans held for investment:
Credit Card:
International credit card . . . . . . . . . . . . . . . . . . . . . . . . . . . . . . . . . . . . . . . . . . . . . . . . $ 53 0.65% $ 70 0.86%
Total credit card . . . . . . . . . . . . . . . . . . . . . . . . . . . . . . . . . . . . . . . . . . . . . . . . . . . . . . . . . 53 0.06 70 0.08
Consumer Banking:
Auto . . . . . . . . . . . . . . . . . . . . . . . . . . . . . . . . . . . . . . . . . . . . . . . . . . . . . . . . . . . . . . . 219 0.53 197 0.52
Home loan(2) . . . . . . . . . . . . . . . . . . . . . . . . . . . . . . . . . . . . . . . . . . . . . . . . . . . . . . . . . 311 1.23 330 1.10
Retail banking. . . . . . . . . . . . . . . . . . . . . . . . . . . . . . . . . . . . . . . . . . . . . . . . . . . . . . . . 28 0.77 22 0.61
Total consumer banking(2) . . . . . . . . . . . . . . . . . . . . . . . . . . . . . . . . . . . . . . . . . . . . . . . . . 558 0.79 549 0.77
Commercial Banking:
Commercial and multifamily real estate. . . . . . . . . . . . . . . . . . . . . . . . . . . . . . . . . . . . 7 0.03 62 0.27
Commercial and industrial . . . . . . . . . . . . . . . . . . . . . . . . . . . . . . . . . . . . . . . . . . . . . . 538 1.45 106 0.39
Total commercial lending . . . . . . . . . . . . . . . . . . . . . . . . . . . . . . . . . . . . . . . . . . . . . 545 0.87 168 0.33
Small-ticket commercial real estate . . . . . . . . . . . . . . . . . . . . . . . . . . . . . . . . . . . . . . . 5 0.83 7 0.96
Total commercial banking(3). . . . . . . . . . . . . . . . . . . . . . . . . . . . . . . . . . . . . . . . . . . . . . . . 550 0.87 175 0.34
Other loans. . . . . . . . . . . . . . . . . . . . . . . . . . . . . . . . . . . . . . . . . . . . . . . . . . . . . . . . . . . . . 9 9.42 15 13.37
Total nonperforming loans held for investment(4) . . . . . . . . . . . . . . . . . . . . . . . . . . . . . . . $ 1,170 0.51 $ 809 0.39
Other nonperforming assets:(5)
Foreclosed property(6) . . . . . . . . . . . . . . . . . . . . . . . . . . . . . . . . . . . . . . . . . . . . . . . . . . $ 126 0.05% $ 139 0.06%
Other assets(7) . . . . . . . . . . . . . . . . . . . . . . . . . . . . . . . . . . . . . . . . . . . . . . . . . . . . . . . . 198 0.09 183 0.09
Total other nonperforming assets. . . . . . . . . . . . . . . . . . . . . . . . . . . . . . . . . . . . . . . . . . . . 324 0.14 322 0.15
Total nonperforming assets . . . . . . . . . . . . . . . . . . . . . . . . . . . . . . . . . . . . . . . . . . . . . . . . $ 1,494 0.65 $ 1,131 0.54
__________
(1) We recognized interest income for loans classified as nonperforming of $44 million and $38 million in 2015 and 2014, respectively. Interest income forgone
related to nonperforming loans was $53 million and $49 million in 2015 and 2014, respectively. Forgone interest income represents the amount of interest
income that would have been recorded during the period for nonperforming loans as of the end of the period had the loans performed according to their
contractual terms.
(2) Excluding the impact of Acquired Loans, the nonperforming loan rate for our home loan and total consumer banking portfolios was 4.68% and 1.08%,
respectively, as of December 31, 2015, compared to 4.86% and 1.14%, respectively, as of December 31, 2014.
(3) The Acquired Loans from the GE Healthcare acquisition are classified and presented as performing because we expect to collect all of our recorded investments
in these loans. Were these loans to be classified based on their risk ratings, our nonperforming loan rate for our total commercial banking portfolio would be
0.93% as of December 31, 2015.
(4) Excluding the impact of domestic credit card loans, nonperforming loans as a percentage of total loans held for investment was 0.83% and 0.62% as of
December 31, 2015 and 2014, respectively.
(5) The denominator used in calculating the nonperforming asset ratios consists of total loans held for investment and total other nonperforming assets.
(6) Includes acquired REOs of $101 million as of both December 31, 2015 and 2014.
(7) Includes the net realizable value of auto loans that have been charged-off as a result of a bankruptcy and repossessed assets obtained in satisfaction of auto
loans.