Capital One 2015 Annual Report Download - page 65
Download and view the complete annual report
Please find page 65 of the 2015 Capital One annual report below. You can navigate through the pages in the report by either clicking on the pages listed below, or by using the keyword search tool below to find specific information within the annual report.-
 1
1 -
2
-
3
-
4
-
5
-
6
-
7
-
8
-
9
-
10
-
11
-
12
-
13
-
14
-
15
-
16
-
17
-
18
-
19
-
20
-
21
-
22
-
23
-
24
-
25
-
26
-
27
-
28
-
29
-
30
-
31
-
32
-
33
-
34
-
35
-
36
-
37
-
38
-
39
-
40
-
41
-
42
-
43
-
44
-
45
-
46
-
47
-
48
-
49
-
50
-
51
-
52
-
53
-
54
-
 55
55 -
 56
56 -
 57
57 -
 58
58 -
 59
59 -
 60
60 -
 61
61 -
 62
62 -
 63
63 -
 64
64 -
 65
65 -
 66
66 -
 67
67 -
 68
68 -
 69
69 -
 70
70 -
 71
71 -
 72
72 -
 73
73 -
 74
74 -
 75
75 -
76
-
77
-
78
-
79
-
80
-
81
-
82
-
83
-
84
-
85
-
86
-
87
-
88
-
89
-
90
-
91
-
92
-
93
-
94
-
95
-
96
-
97
-
98
-
99
-
100
-
101
-
102
-
103
-
104
-
105
-
106
-
107
-
108
-
109
-
110
-
111
-
112
-
113
-
114
-
115
-
116
-
117
-
118
-
119
-
120
-
121
-
122
-
123
-
124
-
125
-
126
-
127
-
128
-
129
-
130
-
131
-
132
-
133
-
134
-
135
-
136
-
137
-
138
-
139
-
140
-
141
-
142
-
143
-
144
-
145
-
146
-
147
-
148
-
149
-
150
-
151
-
152
-
153
-
154
-
155
-
156
-
157
-
158
-
159
-
160
-
161
-
162
-
163
-
164
-
165
-
166
-
167
-
168
-
169
-
170
-
171
-
172
-
173
-
174
-
175
-
176
-
177
-
178
-
179
-
180
-
181
-
182
-
183
-
184
-
185
-
186
-
187
-
188
-
189
-
190
-
191
-
192
-
193
-
194
-
195
-
196
-
197
-
198
-
199
-
200
-
201
-
202
-
203
-
204
-
205
-
206
-
207
-
208
-
209
-
210
-
211
-
212
-
213
-
214
-
215
-
216
-
217
-
218
-
219
-
220
-
221
-
222
-
223
-
224
-
225
-
226
-
227
-
228
-
229
-
230
-
231
-
232
-
233
-
234
-
235
-
236
-
237
-
238
-
239
-
240
-
241
-
242
-
243
-
244
-
245
-
246
-
247
-
248
-
249
-
250
-
251
-
252
-
253
 |
 |

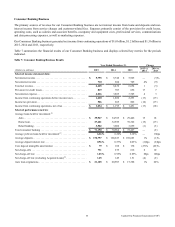
46 Capital One Financial Corporation (COF)
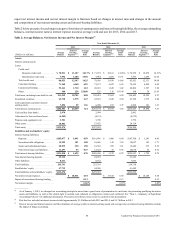
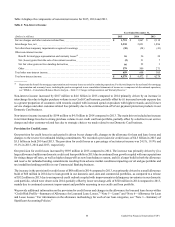
expect net interest income and our net interest margin to fluctuate based on changes in interest rates and changes in the amount
and composition of our interest-earning assets and interest-bearing liabilities.
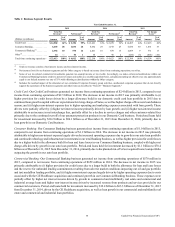
Table 2 below presents, for each major category of our interest-earning assets and interest-bearing liabilities, the average outstanding
balances, interest income earned, interest expense incurred, average yield and rate for 2015, 2014 and 2013.
Table 2: Average Balances, Net Interest Income and Net Interest Margin(1)
Year Ended December 31,
2015 2014 2013
(Dollars in millions) Average
Balance
Interest
Income/
Expense(2)(3)
Average
Yield/
Rate
Average
Balance
Interest
Income/
Expense(2)(3)
Average
Yield/
Rate
Average
Balance
Interest
Income/
Expense(2)(3)
Average
Yield/
Rate
Assets:
Interest-earning assets:
Loans:
Credit card:
Domestic credit card . . . . . . . . . . . $ 78,931 $ 11,187 14.17% $ 71,272 $ 10,161 14.26% $ 74,950 $ 10,876 14.51%
International credit card. . . . . . . . . 7,992 1,200 15.02 7,684 1,269 16.51 7,973 1,295 16.24
Total credit card. . . . . . . . . . . . . . . . . . 86,923 12,387 14.25 78,956 11,430 14.48 82,923 12,171 14.68
Consumer banking. . . . . . . . . . . . . . . . 71,365 4,460 6.25 71,127 4,447 6.25 72,652 4,428 6.09
Commercial banking . . . . . . . . . . . . . . 53,161 1,710 3.22 48,210 1,649 3.42 40,866 1,587 3.88
Other . . . . . . . . . . . . . . . . . . . . . . . . . . 100 228 228.00 126 136 107.94 168 36 21.43
Total loans, including loans held for sale .211,549 18,785 8.88 198,419 17,662 8.90 196,609 18,222 9.27
Investment securities . . . . . . . . . . . . . . . . . 63,738 1,575 2.47 62,547 1,628 2.60 63,522 1,575 2.48
Cash equivalents and other interest-
earning assets. . . . . . . . . . . . . . . . . . . . . . . 7,294 99 1.36 6,208 107 1.72 6,292 101 1.61
Total interest-earning assets . . . . . . . . . . . $282,581 $ 20,459 7.24 $267,174 $ 19,397 7.26 $266,423 $ 19,898 7.47
Cash and due from banks . . . . . . . . . . . . . 2,970 2,994 2,461
Allowance for loan and lease losses . . . . . (4,582) (4,151) (4,572)
Premises and equipment, net . . . . . . . . . . . 3,701 3,790 3,770
Other assets . . . . . . . . . . . . . . . . . . . . . . . . 28,804 27,852 28,118
Total assets. . . . . . . . . . . . . . . . . . . . . . . . . $313,474 $297,659 $296,200
Liabilities and stockholders’ equity:
Interest-bearing liabilities:
Deposits . . . . . . . . . . . . . . . . . . . . . . . . $185,677 $ 1,091 0.59 $181,036 $ 1,088 0.60 $187,700 $ 1,241 0.66
Securitized debt obligations . . . . . . . . 13,929 151 1.08 10,686 145 1.36 10,697 183 1.71
Senior and subordinated notes. . . . . . . 20,935 330 1.58 16,543 299 1.81 12,440 315 2.53
Other borrowings and liabilities . . . . . 11,297 53 0.47 12,325 47 0.38 14,670 53 0.36
Total interest-bearing liabilities. . . . . . . . . $231,838 $ 1,625 0.70 $220,590 $ 1,579 0.72 $225,507 $ 1,792 0.79
Non-interest-bearing deposits . . . . . . . . . . 25,312 24,639 21,345
Other liabilities . . . . . . . . . . . . . . . . . . . . . 8,611 8,162 7,866
Total liabilities. . . . . . . . . . . . . . . . . . . . . . 265,761 253,391 254,718
Stockholders’ equity . . . . . . . . . . . . . . . . . 47,713 44,268 41,482
Total liabilities and stockholders’ equity. . $313,474 $297,659 $296,200
Net interest income/spread . . . . . . . . . . . . $ 18,834 6.54 $ 17,818 6.54 $ 18,106 6.68
Impact of non-interest-bearing funding. . . 0.12 0.13 0.12
Net interest margin . . . . . . . . . . . . . . . . . . 6.66% 6.67% 6.80%
__________
(1) As of January 1, 2015, we changed our accounting principle to move from a gross basis of presentation to a net basis, for presenting qualifying derivative
assets and liabilities, as well as the related right to reclaim cash collateral or obligation to return cash collateral. See “Note 1—Summary of Significant
Accounting Policies” for additional information. Prior period results have been recast to conform to this presentation.
(2) Past due fees included in interest income totaled approximately $1.4 billion in both 2015 and 2014, and $1.7 billion in 2013.
(3) Interest income and interest expense and the calculation of average yields on interest-earning assets and average rates on interest-bearing liabilities include
the impact of hedge accounting.