Capital One 2015 Annual Report Download - page 164
Download and view the complete annual report
Please find page 164 of the 2015 Capital One annual report below. You can navigate through the pages in the report by either clicking on the pages listed below, or by using the keyword search tool below to find specific information within the annual report.-
 1
1 -
2
-
3
-
4
-
5
-
6
-
7
-
8
-
9
-
10
-
11
-
12
-
13
-
14
-
15
-
16
-
17
-
18
-
19
-
20
-
21
-
22
-
23
-
24
-
25
-
26
-
27
-
28
-
29
-
30
-
31
-
32
-
33
-
34
-
35
-
36
-
37
-
38
-
39
-
40
-
41
-
42
-
43
-
44
-
45
-
46
-
47
-
48
-
49
-
50
-
51
-
52
-
53
-
54
-
55
-
56
-
57
-
58
-
59
-
60
-
61
-
62
-
63
-
64
-
65
-
66
-
67
-
68
-
69
-
70
-
71
-
72
-
73
-
74
-
75
-
76
-
77
-
78
-
79
-
80
-
81
-
82
-
83
-
84
-
85
-
86
-
87
-
88
-
89
-
90
-
91
-
92
-
93
-
94
-
95
-
96
-
97
-
98
-
99
-
100
-
101
-
102
-
103
-
104
-
105
-
106
-
107
-
108
-
109
-
110
-
111
-
112
-
113
-
114
-
115
-
116
-
117
-
118
-
119
-
120
-
121
-
122
-
123
-
124
-
125
-
126
-
127
-
128
-
129
-
130
-
131
-
132
-
133
-
134
-
135
-
136
-
137
-
138
-
139
-
140
-
141
-
142
-
143
-
144
-
145
-
146
-
147
-
148
-
149
-
150
-
151
-
152
-
153
-
 154
154 -
 155
155 -
 156
156 -
 157
157 -
 158
158 -
 159
159 -
 160
160 -
 161
161 -
 162
162 -
 163
163 -
 164
164 -
 165
165 -
 166
166 -
 167
167 -
 168
168 -
 169
169 -
 170
170 -
 171
171 -
 172
172 -
 173
173 -
 174
174 -
175
-
176
-
177
-
178
-
179
-
180
-
181
-
182
-
183
-
184
-
185
-
186
-
187
-
188
-
189
-
190
-
191
-
192
-
193
-
194
-
195
-
196
-
197
-
198
-
199
-
200
-
201
-
202
-
203
-
204
-
205
-
206
-
207
-
208
-
209
-
210
-
211
-
212
-
213
-
214
-
215
-
216
-
217
-
218
-
219
-
220
-
221
-
222
-
223
-
224
-
225
-
226
-
227
-
228
-
229
-
230
-
231
-
232
-
233
-
234
-
235
-
236
-
237
-
238
-
239
-
240
-
241
-
242
-
243
-
244
-
245
-
246
-
247
-
248
-
249
-
250
-
251
-
252
-
253
 |
 |

CAPITAL ONE FINANCIAL CORPORATION
NOTES TO CONSOLIDATED FINANCIAL STATEMENTS
145 Capital One Financial Corporation (COF)
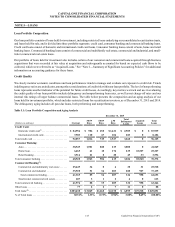
NOTE 5—LOANS
Loan Portfolio Composition
Our loan portfolio consists of loans held for investment, including restricted loans underlying our consolidated securitization trusts,
and loans held for sale, and is divided into three portfolio segments: credit card, consumer banking and commercial banking loans.
Credit card loans consist of domestic and international credit card loans. Consumer banking loans consist of auto, home and retail
banking loans. Commercial banking loans consist of commercial and multifamily real estate, commercial and industrial, and small-
ticket commercial real estate loans.
Our portfolio of loans held for investment also includes certain of our consumer and commercial loans acquired through business
acquisitions that were recorded at fair value at acquisition and subsequently accounted for based on expected cash flows to be
collected, which were referred to as “Acquired Loans.” See “Note 1—Summary of Significant Accounting Policies” for additional
information on accounting guidance for these loans.
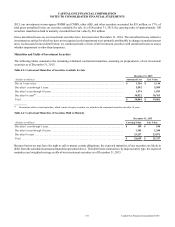
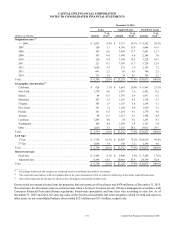
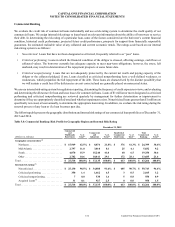
Credit Quality
We closely monitor economic conditions and loan performance trends to manage and evaluate our exposure to credit risk. Trends
in delinquency ratios are an indicator, among other considerations, of credit risk within our loan portfolio. The level of nonperforming
loans represents another indicator of the potential for future credit losses. Accordingly, key metrics we track and use in evaluating
the credit quality of our loan portfolio include delinquency and nonperforming loan rates, as well as net charge-off rates and our
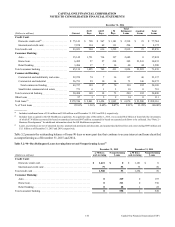
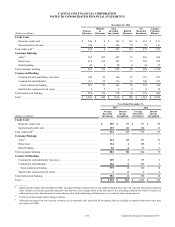
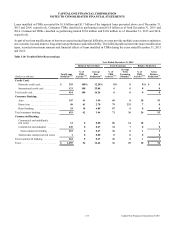
internal risk ratings of larger balance commercial loans. The table below presents the composition and an aging analysis of our
loans held for investment portfolio, which includes restricted loans for securitization investors, as of December 31, 2015 and 2014.
The delinquency aging includes all past due loans, both performing and nonperforming.
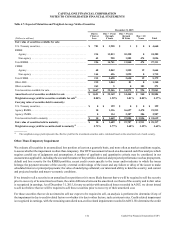
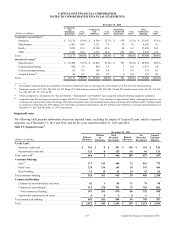
Table 5.1: Loan Portfolio Composition and Aging Analysis
December 31, 2015
(Dollars in millions) Current
30-59
Days
60-89
Days
> 90
Days
Total
Delinquent
Loans
Acquired
Loans
Total
Loans
Credit Card:
Domestic credit card(1). . . . . . . . . . . . . . . . . . . . $ 84,954 $ 906 $ 658 $ 1,421 $ 2,985 $ 0 $ 87,939
International credit card. . . . . . . . . . . . . . . . . . . 7,903 110 67 106 283 0 8,186
Total credit card . . . . . . . . . . . . . . . . . . . . . . . . . . . 92,857 1,016 725 1,527 3,268 0 96,125
Consumer Banking:
Auto . . . . . . . . . . . . . . . . . . . . . . . . . . . . . . . . . . 38,549 1,901 880 219 3,000 0 41,549
Home loan . . . . . . . . . . . . . . . . . . . . . . . . . . . . . 6,465 41 18 176 235 18,527 25,227
Retail banking . . . . . . . . . . . . . . . . . . . . . . . . . . 3,514 21 8 20 49 33 3,596
Total consumer banking . . . . . . . . . . . . . . . . . . . . . 48,528 1,963 906 415 3,284 18,560 70,372
Commercial Banking(2):
Commercial and multifamily real estate . . . . . . 25,449 34 0 4 38 31 25,518
Commercial and industrial . . . . . . . . . . . . . . . . 35,920 51 34 203 288 927 37,135
Total commercial lending . . . . . . . . . . . . . . . . 61,369 85 34 207 326 958 62,653
Small-ticket commercial real estate. . . . . . . . . . 607 3 1 2 6 0 613
Total commercial banking . . . . . . . . . . . . . . . . . . . 61,976 88 35 209 332 958 63,266
Other loans . . . . . . . . . . . . . . . . . . . . . . . . . . . . . . . 77 2 2 7 11 0 88
Total loans(3) . . . . . . . . . . . . . . . . . . . . . . . . . . . . . . $ 203,438 $ 3,069 $1,668 $ 2,158 $ 6,895 $ 19,518 $ 229,851
% of Total loans . . . . . . . . . . . . . . . . . . . . . . . . . . . 88.51% 1.33% 0.73% 0.94% 3.00% 8.49% 100.00%