Capital One 2015 Annual Report Download - page 54
Download and view the complete annual report
Please find page 54 of the 2015 Capital One annual report below. You can navigate through the pages in the report by either clicking on the pages listed below, or by using the keyword search tool below to find specific information within the annual report.-
 1
1 -
2
-
3
-
4
-
5
-
6
-
7
-
8
-
9
-
10
-
11
-
12
-
13
-
14
-
15
-
16
-
17
-
18
-
19
-
20
-
21
-
22
-
23
-
24
-
25
-
26
-
27
-
28
-
29
-
30
-
31
-
32
-
33
-
34
-
35
-
36
-
37
-
38
-
39
-
40
-
41
-
42
-
43
-
 44
44 -
 45
45 -
 46
46 -
 47
47 -
 48
48 -
 49
49 -
 50
50 -
 51
51 -
 52
52 -
 53
53 -
 54
54 -
 55
55 -
 56
56 -
 57
57 -
 58
58 -
 59
59 -
 60
60 -
 61
61 -
 62
62 -
 63
63 -
 64
64 -
65
-
66
-
67
-
68
-
69
-
70
-
71
-
72
-
73
-
74
-
75
-
76
-
77
-
78
-
79
-
80
-
81
-
82
-
83
-
84
-
85
-
86
-
87
-
88
-
89
-
90
-
91
-
92
-
93
-
94
-
95
-
96
-
97
-
98
-
99
-
100
-
101
-
102
-
103
-
104
-
105
-
106
-
107
-
108
-
109
-
110
-
111
-
112
-
113
-
114
-
115
-
116
-
117
-
118
-
119
-
120
-
121
-
122
-
123
-
124
-
125
-
126
-
127
-
128
-
129
-
130
-
131
-
132
-
133
-
134
-
135
-
136
-
137
-
138
-
139
-
140
-
141
-
142
-
143
-
144
-
145
-
146
-
147
-
148
-
149
-
150
-
151
-
152
-
153
-
154
-
155
-
156
-
157
-
158
-
159
-
160
-
161
-
162
-
163
-
164
-
165
-
166
-
167
-
168
-
169
-
170
-
171
-
172
-
173
-
174
-
175
-
176
-
177
-
178
-
179
-
180
-
181
-
182
-
183
-
184
-
185
-
186
-
187
-
188
-
189
-
190
-
191
-
192
-
193
-
194
-
195
-
196
-
197
-
198
-
199
-
200
-
201
-
202
-
203
-
204
-
205
-
206
-
207
-
208
-
209
-
210
-
211
-
212
-
213
-
214
-
215
-
216
-
217
-
218
-
219
-
220
-
221
-
222
-
223
-
224
-
225
-
226
-
227
-
228
-
229
-
230
-
231
-
232
-
233
-
234
-
235
-
236
-
237
-
238
-
239
-
240
-
241
-
242
-
243
-
244
-
245
-
246
-
247
-
248
-
249
-
250
-
251
-
252
-
253
 |
 |

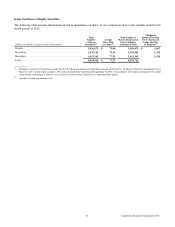
35 Capital One Financial Corporation (COF)
December 31, Change
(Dollars in millions, except as noted) 2015 2014 2013 2012 2011 2015 vs.
2014
2014 vs.
2013
Other
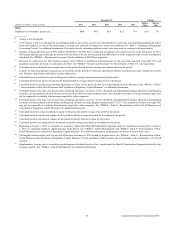
Employees (in thousands), period end . . . . . . . . . . . . . . . . . . . . 45.4 46.0 45.4 42.2 34.1 (1)% 1%
__________
** Change is not meaningful.
(1) As of January 1, 2015, we changed our accounting principle to move from a gross basis of presentation to a net basis, for presenting qualifying derivative
assets and liabilities, as well as the related right to reclaim cash collateral or obligation to return cash collateral. See “Note 1—Summary of Significant
Accounting Policies” for additional information. Prior period results, excluding regulatory ratios, have been recast to conform to this presentation.
(2) Includes a bargain purchase gain of $594 million attributable to the ING Direct acquisition recognized in non-interest income in the first quarter of 2012.
The bargain purchase gain represents the excess of the fair value of the net assets acquired from ING Direct as of the acquisition date over the consideration
transferred. See “MD&A—Glossary and Acronyms” for the definition of ING Direct acquisition.
(3) Provision for credit losses for 2012 includes expense of $1.2 billion to establish an initial allowance for the receivables acquired in the 2012 U.S. card
acquisition accounted for based on contractual cash flows. See “MD&A—Glossary and Acronyms” for the definition of 2012 U.S. card acquisition.
(4) Calculated based on dividends per common share for the period divided by basic earnings per common share for the period.
(5) Consists of credit card purchase transactions, net of returns, for the period for both loans classified as held for investment and loans classified as held for
sale. Excludes cash advance and balance transfer transactions.
(6) Calculated based on total net revenue for the period divided by average interest-earning assets for the period.
(7) Calculated based on net interest income for the period divided by average interest-earning assets for the period.
(8) Calculated based on income from continuing operations, net of tax, for the period divided by average tangible assets for the period. See “MD&A—Table F
—Reconciliation of Non-GAAP Measures and Calculation of Regulatory Capital Measures” for additional information.
(9) Calculated based on the sum of (i) income from continuing operations, net of tax; (ii) less dividends and undistributed earnings allocated to participating
securities; (iii) less preferred stock dividends, for the period, divided by average common equity. Our calculation of return on average common equity may
not be comparable to similarly titled measures reported by other companies.
(10) Calculated based on the sum of (i) income from continuing operations, net of tax; (ii) less dividends and undistributed earnings allocated to participating
securities; (iii) less preferred stock dividends, for the period, divided by average tangible common equity (“TCE”). Our calculation of return on average TCE
may not be comparable to similarly titled measures reported by other companies. See “MD&A—Table F—Reconciliation of Non-GAAP Measures and
Calculation of Regulatory Capital Measures” for additional information.
(11) Calculated based on average stockholders’ equity for the period divided by average total assets for the period.
(12) Calculated based on non-interest expense for the period divided by average loans held for investment for the period.
(13) Calculated based on non-interest expense for the period divided by total net revenue for the period.
(14) Calculated based on net charge-offs for the period divided by average loans held for investment for the period.
(15) Beginning on January 1, 2014, we calculate our regulatory capital under Basel III Standardized Approach subject to transition provisions. Prior to January
1, 2014, we calculated regulatory capital measures under Basel I. See “MD&A—Capital Management” and “MD&A—Table F—Reconciliation of Non-
GAAP Measures and Calculation of Regulatory Capital Measures” for additional information, including the calculation of each of these ratios.
(16) The tangible common equity ratio is a non-GAAP measure calculated as TCE divided by tangible assets. See “MD&A—Table F—Reconciliation of Non-
GAAP Measures and Calculation of Regulatory Capital Measures” for the calculation of this measure and reconciliation to the comparative U.S. GAAP
measure.
(17) Supplementary leverage ratio is a regulatory capital measure calculated based on Tier 1 capital under the Basel III Standardized Approach divided by total
leverage exposure. See “MD&A—Capital Management” for additional information.