Capital One 2015 Annual Report Download - page 56
Download and view the complete annual report
Please find page 56 of the 2015 Capital One annual report below. You can navigate through the pages in the report by either clicking on the pages listed below, or by using the keyword search tool below to find specific information within the annual report.-
 1
1 -
2
-
3
-
4
-
5
-
6
-
7
-
8
-
9
-
10
-
11
-
12
-
13
-
14
-
15
-
16
-
17
-
18
-
19
-
20
-
21
-
22
-
23
-
24
-
25
-
26
-
27
-
28
-
29
-
30
-
31
-
32
-
33
-
34
-
35
-
36
-
37
-
38
-
39
-
40
-
41
-
42
-
43
-
44
-
45
-
 46
46 -
 47
47 -
 48
48 -
 49
49 -
 50
50 -
 51
51 -
 52
52 -
 53
53 -
 54
54 -
 55
55 -
 56
56 -
 57
57 -
 58
58 -
 59
59 -
 60
60 -
 61
61 -
 62
62 -
 63
63 -
 64
64 -
 65
65 -
 66
66 -
67
-
68
-
69
-
70
-
71
-
72
-
73
-
74
-
75
-
76
-
77
-
78
-
79
-
80
-
81
-
82
-
83
-
84
-
85
-
86
-
87
-
88
-
89
-
90
-
91
-
92
-
93
-
94
-
95
-
96
-
97
-
98
-
99
-
100
-
101
-
102
-
103
-
104
-
105
-
106
-
107
-
108
-
109
-
110
-
111
-
112
-
113
-
114
-
115
-
116
-
117
-
118
-
119
-
120
-
121
-
122
-
123
-
124
-
125
-
126
-
127
-
128
-
129
-
130
-
131
-
132
-
133
-
134
-
135
-
136
-
137
-
138
-
139
-
140
-
141
-
142
-
143
-
144
-
145
-
146
-
147
-
148
-
149
-
150
-
151
-
152
-
153
-
154
-
155
-
156
-
157
-
158
-
159
-
160
-
161
-
162
-
163
-
164
-
165
-
166
-
167
-
168
-
169
-
170
-
171
-
172
-
173
-
174
-
175
-
176
-
177
-
178
-
179
-
180
-
181
-
182
-
183
-
184
-
185
-
186
-
187
-
188
-
189
-
190
-
191
-
192
-
193
-
194
-
195
-
196
-
197
-
198
-
199
-
200
-
201
-
202
-
203
-
204
-
205
-
206
-
207
-
208
-
209
-
210
-
211
-
212
-
213
-
214
-
215
-
216
-
217
-
218
-
219
-
220
-
221
-
222
-
223
-
224
-
225
-
226
-
227
-
228
-
229
-
230
-
231
-
232
-
233
-
234
-
235
-
236
-
237
-
238
-
239
-
240
-
241
-
242
-
243
-
244
-
245
-
246
-
247
-
248
-
249
-
250
-
251
-
252
-
253
 |
 |
37 Capital One Financial Corporation (COF)
Total Company Performance
• Earnings: Our net income decreased by $378 million to $4.1 billion in 2015, compared to 2014. The decrease in net income
from continuing operations in 2015 was driven by (i) an increase in the provision for credit losses in our domestic credit
card loan portfolio due to a larger allowance build in 2015 due to continued loan growth coupled with our expectations for
rising charge-off rates, and higher charge-offs as new loan balances season; (ii) an increase in the provision for credit losses
in our commercial loan portfolio due to a larger build in both the allowance and reserve for unfunded lending commitments
resulting from adverse market conditions impacting our oil and gas portfolio and taxi medallion lending portfolio; and (iii)
an increase in non-interest expense driven by higher operating and marketing expenses associated with loan growth and
continued technology and infrastructure investments. In 2015, we recorded charges totaling $150 million for severance and
related benefits pursuant to our ongoing benefit programs and certain site closures, as a result of the realignment of our
workforce. We also recorded a build in the U.K. Payment Protection Insurance customer refund reserve (“U.K. PPI Reserve”)
of $147 million in 2015, reflecting recent U.K. regulatory developments and updated estimates of future complaint levels.
These expenses were partially offset by (i) higher interest income due to growth in our credit card, commercial and auto
loan portfolios, partially offset by the planned run-off of our acquired home loan portfolio; and (ii) an increase in non-
interest income primarily attributable to higher net interchange fees, partially offset by lower service charges and other
customer-related fees primarily driven by the continued run-off of our payment protection products in our Domestic Card
business. The increase in net income from discontinued operations in 2015 was primarily driven by a reduction in our
mortgage representation and warranty reserve in 2015 resulting from favorable industry legal developments.
• Loans Held for Investment: Period-end loans held for investment increased by $21.5 billion to $229.9 billion as of
December 31, 2015 from December 31, 2014 and average loans held for investment increased by $12.8 billion to $210.7
billion in 2015 compared to 2014. The increases were primarily driven by continued growth in our credit card, auto and
commercial loan portfolios, including loans acquired from the GE Healthcare acquisition, partially offset by the planned
run-off of our acquired home loan portfolio.
• Net Charge-off and Delinquency Statistics: Our net charge-off rate increased by 3 basis points to 1.75% in 2015 compared
to 2014. Net charge-off rates remained low compared to our long-term trends, while we experienced rising losses in our
taxi medallion lending portfolio and oil and gas portfolio within our Commercial Banking business. Our 30+ day delinquency
rate increased by 9 basis points to 3.00% as of December 31, 2015, from December 31, 2014, primarily due to the seasoning
of recent credit card loan originations and adverse market conditions impacting our taxi medallion lending portfolio. We
provide additional information on our credit quality metrics below under “Business Segment Financial Performance” and
“Credit Risk Profile.”
• Allowance for Loan and Lease Losses: Our allowance for loan and lease losses increased by $747 million to $5.1 billion
as of December 31, 2015 from December 31, 2014. The increase in the allowance for loan and lease losses was primarily
driven by continued loan growth, coupled with our expectations of rising charge-off rates in our domestic credit card portfolio
driven by growth, as well as adverse market conditions impacting our oil and gas portfolio and taxi medallion lending
portfolio in our Commercial Banking business. These factors also contributed to a higher allowance coverage ratio, which
increased by 13 basis points to 2.23% as of December 31, 2015 from December 31, 2014.
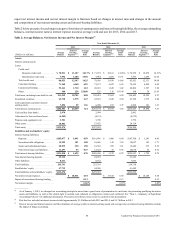
Business Segment Financial Performance
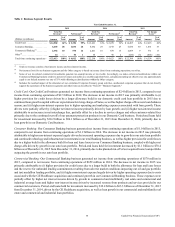
Table 1 summarizes our business segment results, which we report based on revenue and income from continuing operations, net
of tax, for the years ended December 31, 2015, 2014 and 2013. We provide information on the allocation methodologies used to
derive our business segment results in “Note 20—Business Segments.”