Capital One 2015 Annual Report Download - page 14
Download and view the complete annual report
Please find page 14 of the 2015 Capital One annual report below. You can navigate through the pages in the report by either clicking on the pages listed below, or by using the keyword search tool below to find specific information within the annual report.-
 1
1 -
2
-
3
-
 4
4 -
 5
5 -
 6
6 -
 7
7 -
 8
8 -
 9
9 -
 10
10 -
 11
11 -
 12
12 -
 13
13 -
 14
14 -
 15
15 -
 16
16 -
 17
17 -
 18
18 -
 19
19 -
 20
20 -
 21
21 -
 22
22 -
 23
23 -
 24
24 -
25
-
26
-
27
-
28
-
29
-
30
-
31
-
32
-
33
-
34
-
35
-
36
-
37
-
38
-
39
-
40
-
41
-
42
-
43
-
44
-
45
-
46
-
47
-
48
-
49
-
50
-
51
-
52
-
53
-
54
-
55
-
56
-
57
-
58
-
59
-
60
-
61
-
62
-
63
-
64
-
65
-
66
-
67
-
68
-
69
-
70
-
71
-
72
-
73
-
74
-
75
-
76
-
77
-
78
-
79
-
80
-
81
-
82
-
83
-
84
-
85
-
86
-
87
-
88
-
89
-
90
-
91
-
92
-
93
-
94
-
95
-
96
-
97
-
98
-
99
-
100
-
101
-
102
-
103
-
104
-
105
-
106
-
107
-
108
-
109
-
110
-
111
-
112
-
113
-
114
-
115
-
116
-
117
-
118
-
119
-
120
-
121
-
122
-
123
-
124
-
125
-
126
-
127
-
128
-
129
-
130
-
131
-
132
-
133
-
134
-
135
-
136
-
137
-
138
-
139
-
140
-
141
-
142
-
143
-
144
-
145
-
146
-
147
-
148
-
149
-
150
-
151
-
152
-
153
-
154
-
155
-
156
-
157
-
158
-
159
-
160
-
161
-
162
-
163
-
164
-
165
-
166
-
167
-
168
-
169
-
170
-
171
-
172
-
173
-
174
-
175
-
176
-
177
-
178
-
179
-
180
-
181
-
182
-
183
-
184
-
185
-
186
-
187
-
188
-
189
-
190
-
191
-
192
-
193
-
194
-
195
-
196
-
197
-
198
-
199
-
200
-
201
-
202
-
203
-
204
-
205
-
206
-
207
-
208
-
209
-
210
-
211
-
212
-
213
-
214
-
215
-
216
-
217
-
218
-
219
-
220
-
221
-
222
-
223
-
224
-
225
-
226
-
227
-
228
-
229
-
230
-
231
-
232
-
233
-
234
-
235
-
236
-
237
-
238
-
239
-
240
-
241
-
242
-
243
-
244
-
245
-
246
-
247
-
248
-
249
-
250
-
251
-
252
-
253
 |
 |

13
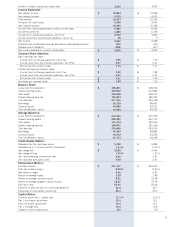
Dollars in millions, except per share data 2015 2014
Income Statement:
Net interest income $ 18,834 $ 17,818
Non-interest income 4,579 4,472
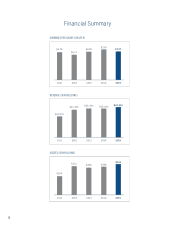
Total revenue 23,413 22,290
Provision for credit losses 4,536 3,541
Non-interest expense 12,996 12,180
Income from continuing operations before income taxes 5,881 6,569
Income tax provision 1,869 2,146
Income from continuing operations, net of tax 4,012 4,423
Income (loss) from discontinued operations, net of tax 38 5
Net income 4,050 4,428
Dividends and undistributed earnings allocated to participating securities (20) (18)
Preferred stock dividends (158) (67)
Net income available to common stockholders $ 3,872 $ 4,343
Common Share Statistics:
Basic earnings per share:
Income from continuing operations, net of tax $ 7.08 $ 7.70
Income (loss) from discontinued operations, net of tax 0.07 0.01
Net income per common share $ 7.15 $ 7.71
Diluted earnings per common share:
Income from continuing operations, net of tax $ 7.00 $ 7.58
Income (loss) from discontinued operations, net of tax 0.07 0.01
Net income per common share $ 7.07 $ 7.59
Dividends per common share $ 1.50 $ 1.20
Balance Sheet:
Loans held for investment $ 229,851 $ 208,316
Interest-earning assets 302,007 277,849
Total assets 334,048 308,167
Interest-bearing deposits 191,874 180,467
Total deposits 217,721 205,548
Borrowings 59,115 48,457
Common equity 43,990 43,231
Total stockholders’ equity 47,284 45,053
Average Balances:
Loans held for investment $ 210,745 $ 197,925
Interest-earning assets 282,581 267,174
Total assets 313,474 297,659
Interest-bearing deposits 185,677 181,036
Total deposits 210,989 205,675
Borrowings 45,420 38,882
Common equity 45,072 43,055
Total stockholders’ equity 47,713 44,268
Credit Quality Metrics:
Allowance for loan and lease losses $ 5,130 $ 4,383
Allowance as a % of loans held for investment 2.23 % 2.10 %
Net charge-offs $ 3,695 $ 3,414
Net charge-off rate 1.75 % 1.72 %
30+ day performing delinquency rate 2.69 2.62
30+ day total delinquency rate 3.00 2.91
Performance Metrics:
Purchase volume $ 271,167 $ 224,750
Total net revenue margin 8.29 % 8.34 %
Net interest margin 6.66 6.67
Return on average assets 1.28 1.49
Return on average common equity 8.51 10.08
Return on average tangible common equity 12.87 15.79
Efficiency ratio 55.51 54.64
Effective income tax rate on continuing operations 31.8 32.7
Employees (in thousands), period end 45.4 46.0
Capital Ratios:
Common equity Tier 1 capital ratio 11.1 % 12.5 %
Tier 1 risk-based capital ratio 12.4 13.2
Total risk-based capital ratio 14.6 15.1
Tier 1 leverage ratio 10.6 10.8
Tangible common equity ratio 8.9 9.5