Capital One 2015 Annual Report Download - page 116
Download and view the complete annual report
Please find page 116 of the 2015 Capital One annual report below. You can navigate through the pages in the report by either clicking on the pages listed below, or by using the keyword search tool below to find specific information within the annual report.-
 1
1 -
2
-
3
-
4
-
5
-
6
-
7
-
8
-
9
-
10
-
11
-
12
-
13
-
14
-
15
-
16
-
17
-
18
-
19
-
20
-
21
-
22
-
23
-
24
-
25
-
26
-
27
-
28
-
29
-
30
-
31
-
32
-
33
-
34
-
35
-
36
-
37
-
38
-
39
-
40
-
41
-
42
-
43
-
44
-
45
-
46
-
47
-
48
-
49
-
50
-
51
-
52
-
53
-
54
-
55
-
56
-
57
-
58
-
59
-
60
-
61
-
62
-
63
-
64
-
65
-
66
-
67
-
68
-
69
-
70
-
71
-
72
-
73
-
74
-
75
-
76
-
77
-
78
-
79
-
80
-
81
-
82
-
83
-
84
-
85
-
86
-
87
-
88
-
89
-
90
-
91
-
92
-
93
-
94
-
95
-
96
-
97
-
98
-
99
-
100
-
101
-
102
-
103
-
104
-
105
-
 106
106 -
 107
107 -
 108
108 -
 109
109 -
 110
110 -
 111
111 -
 112
112 -
 113
113 -
 114
114 -
 115
115 -
 116
116 -
 117
117 -
 118
118 -
 119
119 -
 120
120 -
 121
121 -
 122
122 -
 123
123 -
 124
124 -
 125
125 -
 126
126 -
127
-
128
-
129
-
130
-
131
-
132
-
133
-
134
-
135
-
136
-
137
-
138
-
139
-
140
-
141
-
142
-
143
-
144
-
145
-
146
-
147
-
148
-
149
-
150
-
151
-
152
-
153
-
154
-
155
-
156
-
157
-
158
-
159
-
160
-
161
-
162
-
163
-
164
-
165
-
166
-
167
-
168
-
169
-
170
-
171
-
172
-
173
-
174
-
175
-
176
-
177
-
178
-
179
-
180
-
181
-
182
-
183
-
184
-
185
-
186
-
187
-
188
-
189
-
190
-
191
-
192
-
193
-
194
-
195
-
196
-
197
-
198
-
199
-
200
-
201
-
202
-
203
-
204
-
205
-
206
-
207
-
208
-
209
-
210
-
211
-
212
-
213
-
214
-
215
-
216
-
217
-
218
-
219
-
220
-
221
-
222
-
223
-
224
-
225
-
226
-
227
-
228
-
229
-
230
-
231
-
232
-
233
-
234
-
235
-
236
-
237
-
238
-
239
-
240
-
241
-
242
-
243
-
244
-
245
-
246
-
247
-
248
-
249
-
250
-
251
-
252
-
253
 |
 |

97 Capital One Financial Corporation (COF)
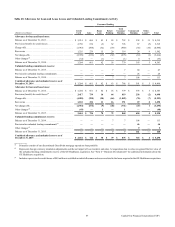
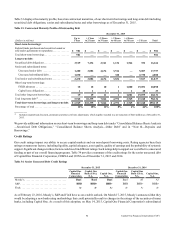
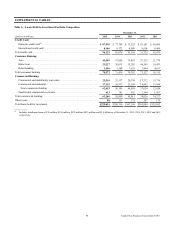
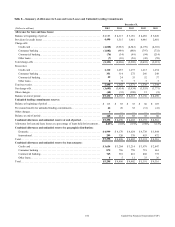
Table B—Performing Delinquencies(1)
December 31,
2015 2014 2013 2012 2011
(Dollars in millions) Loans(2)(3)
% of
Total
Loans(4) Loans(2)(3)
% of
Total
Loans(4) Loans(2)(3)
% of
Total
Loans(4) Loans(2)(3)
% of
Total
Loans(4) Loans(2)(3)
% of
Total
Loans(4)
Loans held for investment .$ 229,851 100.00% $ 208,316 100.00% $ 197,199 100.00% $ 205,889 100.00% $ 135,892 100.00%
Delinquent loans:
30-59 days . . . . . . . . . . 3,042 1.33% 2,803 1.34% 2,584 1.31% 2,629 1.28% 2,267 1.67%
60-89 days . . . . . . . . . . 1,636 0.71 1,394 0.67 1,313 0.67 1,399 0.68 1,043 0.77
90-119 days . . . . . . . . . 603 0.26 508 0.24 512 0.26 628 0.30 497 0.36
120-149 days . . . . . . . . 493 0.21 409 0.20 418 0.21 485 0.24 390 0.29
150 or more days . . . . . 409 0.18 346 0.17 361 0.18 414 0.20 355 0.26
Total. . . . . . . . . . . . . . . . . . $ 6,183 2.69% $ 5,460 2.62% $ 5,188 2.63% $ 5,555 2.70% $ 4,552 3.35%
By geographic area:
Domestic . . . . . . . . . . . $ 5,939 2.58% $ 5,220 2.50% $ 4,889 2.48% $ 5,247 2.55% $ 4,114 3.03%
International. . . . . . . . . 244 0.11 240 0.12 299 0.15 308 0.15 438 0.32
Total. . . . . . . . . . . . . . . . . . $ 6,183 2.69% $ 5,460 2.62% $ 5,188 2.63% $ 5,555 2.70% $ 4,552 3.35%
__________
(1) Acquired Loans are included in loans held for investment, but excluded from delinquent loans as these loans are considered performing in accordance with
our expectations as of the purchase date, as we recorded these loans at estimated fair value when we acquired them. As of December 31, 2015, 2014, 2013,
2012 and 2011 the Acquired Loan portfolio’s contractual 30 to 89 day delinquencies total $99 million, $152 million, $223 million, $369 million and $162
million, respectively. For loans 90+ day past due, see “MD&A—Table C—Nonperforming Loans and Other Nonperforming Assets.”
(2) Credit card loan balances are reported net of the finance charge and fee reserve, which totaled $262 million, $216 million, $190 million, $307 million and
$74 million as of December 31, 2015, 2014, 2013, 2012 and 2011, respectively.
(3) The performing loan modifications and restructuring totaled $1.4 billion, $1.2 billion and $1.3 billion as of December 31, 2015, 2014 and 2013, respectively,
and $1.4 billion as of both December 31, 2012 and 2011.
(4) Calculated by dividing loans in each delinquency status category and geographic region as of the end of the period by the total loan portfolio.