Capital One 2015 Annual Report Download - page 172
Download and view the complete annual report
Please find page 172 of the 2015 Capital One annual report below. You can navigate through the pages in the report by either clicking on the pages listed below, or by using the keyword search tool below to find specific information within the annual report.-
 1
1 -
2
-
3
-
4
-
5
-
6
-
7
-
8
-
9
-
10
-
11
-
12
-
13
-
14
-
15
-
16
-
17
-
18
-
19
-
20
-
21
-
22
-
23
-
24
-
25
-
26
-
27
-
28
-
29
-
30
-
31
-
32
-
33
-
34
-
35
-
36
-
37
-
38
-
39
-
40
-
41
-
42
-
43
-
44
-
45
-
46
-
47
-
48
-
49
-
50
-
51
-
52
-
53
-
54
-
55
-
56
-
57
-
58
-
59
-
60
-
61
-
62
-
63
-
64
-
65
-
66
-
67
-
68
-
69
-
70
-
71
-
72
-
73
-
74
-
75
-
76
-
77
-
78
-
79
-
80
-
81
-
82
-
83
-
84
-
85
-
86
-
87
-
88
-
89
-
90
-
91
-
92
-
93
-
94
-
95
-
96
-
97
-
98
-
99
-
100
-
101
-
102
-
103
-
104
-
105
-
106
-
107
-
108
-
109
-
110
-
111
-
112
-
113
-
114
-
115
-
116
-
117
-
118
-
119
-
120
-
121
-
122
-
123
-
124
-
125
-
126
-
127
-
128
-
129
-
130
-
131
-
132
-
133
-
134
-
135
-
136
-
137
-
138
-
139
-
140
-
141
-
142
-
143
-
144
-
145
-
146
-
147
-
148
-
149
-
150
-
151
-
152
-
153
-
154
-
155
-
156
-
157
-
158
-
159
-
160
-
161
-
 162
162 -
 163
163 -
 164
164 -
 165
165 -
 166
166 -
 167
167 -
 168
168 -
 169
169 -
 170
170 -
 171
171 -
 172
172 -
 173
173 -
 174
174 -
 175
175 -
 176
176 -
 177
177 -
 178
178 -
 179
179 -
 180
180 -
 181
181 -
 182
182 -
183
-
184
-
185
-
186
-
187
-
188
-
189
-
190
-
191
-
192
-
193
-
194
-
195
-
196
-
197
-
198
-
199
-
200
-
201
-
202
-
203
-
204
-
205
-
206
-
207
-
208
-
209
-
210
-
211
-
212
-
213
-
214
-
215
-
216
-
217
-
218
-
219
-
220
-
221
-
222
-
223
-
224
-
225
-
226
-
227
-
228
-
229
-
230
-
231
-
232
-
233
-
234
-
235
-
236
-
237
-
238
-
239
-
240
-
241
-
242
-
243
-
244
-
245
-
246
-
247
-
248
-
249
-
250
-
251
-
252
-
253
 |
 |

CAPITAL ONE FINANCIAL CORPORATION
NOTES TO CONSOLIDATED FINANCIAL STATEMENTS
153 Capital One Financial Corporation (COF)
December 31, 2014
(Dollars in millions)
Commercial
and
Multifamily
Real Estate
% of
Total(1)
Commercial
and
Industrial
% of
Total(1)
Small-ticket
Commercial
Real Estate
% of
Total(1)
Total
Commercial
Banking
% of
Total(1)
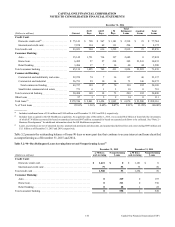
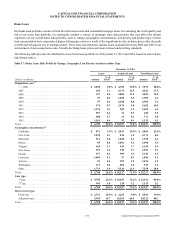
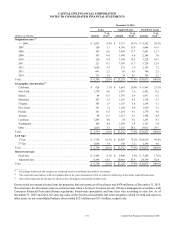
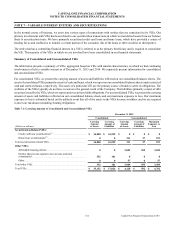
Geographic concentration:(2)
Northeast. . . . . . . . . . . . . . . . . . . . . . . . . . $ 15,135 65.4% $ 6,384 23.7% $ 478 61.2% $ 21,997 43.2%
Mid-Atlantic . . . . . . . . . . . . . . . . . . . . . . . 2,491 10.8 2,121 7.9 30 3.8 4,642 9.1
South. . . . . . . . . . . . . . . . . . . . . . . . . . . . . 3,070 13.3 12,310 45.6 48 6.2 15,428 30.3
Other . . . . . . . . . . . . . . . . . . . . . . . . . . . . . 2,441 10.5 6,157 22.8 225 28.8 8,823 17.4
Total . . . . . . . . . . . . . . . . . . . . . . . . . . . . . . . . $ 23,137 100.0% $ 26,972 100.0% $ 781 100.0% $ 50,890 100.0%
Internal risk rating:(3)
Noncriticized . . . . . . . . . . . . . . . . . . . . . . $ 22,489 97.2% $ 25,836 95.8% $ 767 98.2% $ 49,092 96.5%
Criticized performing . . . . . . . . . . . . . . . . 540 2.3 884 3.3 7 0.9 1,431 2.8
Criticized nonperforming . . . . . . . . . . . . . 62 0.3 106 0.4 7 0.9 175 0.3
Acquired Loans(4) . . . . . . . . . . . . . . . . . . . 46 0.2 146 0.5 0 0.0 192 0.4
Total . . . . . . . . . . . . . . . . . . . . . . . . . . . . . . . . $ 23,137 100.0% $ 26,972 100.0% $ 781 100.0% $ 50,890 100.0%
__________
(1) Percentages calculated based on total held for investment commercial loans in each respective loan category as of the end of the reported period.
(2) Northeast consists of CT, MA, ME, NH, NJ, NY, PA and VT. Mid-Atlantic consists of DC, DE, MD, VA and WV. South consists of AL, AR, FL, GA, KY,
LA, MS, MO, NC, SC, TN and TX.
(3) Criticized exposures correspond to the “Special Mention,” “Substandard” and “Doubtful” asset categories defined by banking regulatory authorities.
(4) Acquired Loans that are being accounted for under ASC310-30 (formerly “SOP 03-3”) are classified as noncriticized. From a managed perspective, we
evaluate loans based on their actual risk ratings. Were these Acquired Loans to be classified based on their risk ratings, $128 million and $171 million would
be classified as Noncriticized, $793 million and $18 million as Criticized performing, and $37 million and $3 million as Criticized nonperforming as of
December 31, 2015 and December 31, 2014, respectively.
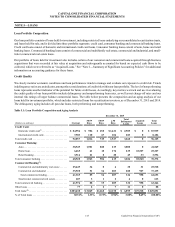
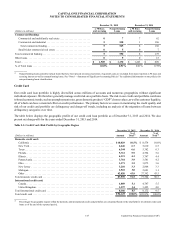
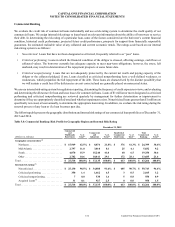
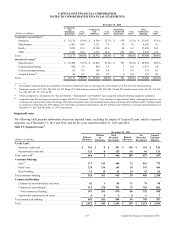
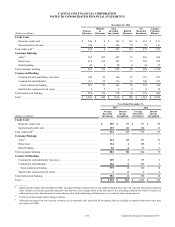
Impaired Loans
The following table presents information about our impaired loans, excluding the impact of Acquired Loans, which is reported
separately as of December 31, 2015 and 2014, and for the years ended December 31, 2015 and 2014:
Table 5.9: Impaired Loans(1)
December 31, 2015
(Dollars in millions)
With an
Allowance
Without
an
Allowance
Total
Recorded
Investment
Related
Allowance
Net
Recorded
Investment
Unpaid
Principal
Balance
Credit Card:
Domestic credit card . . . . . . . . . . . . . . . . . . . . . . . . . . . . . . $ 541 $ 0 $ 541 $ 150 $ 391 $ 526
International credit card. . . . . . . . . . . . . . . . . . . . . . . . . . . . 125 0 125 59 66 121
Total credit card(2) . . . . . . . . . . . . . . . . . . . . . . . . . . . . . . . . . . . 666 0 666 209 457 647
Consumer Banking:
Auto(3) . . . . . . . . . . . . . . . . . . . . . . . . . . . . . . . . . . . . . . . . . 273 215 488 22 466 772
Home loan . . . . . . . . . . . . . . . . . . . . . . . . . . . . . . . . . . . . . . 229 136 365 18 347 456
Retail banking . . . . . . . . . . . . . . . . . . . . . . . . . . . . . . . . . . . 51 10 61 14 47 62
Total consumer banking . . . . . . . . . . . . . . . . . . . . . . . . . . . . . . 553 361 914 54 860 1,290
Commercial Banking:
Commercial and multifamily real estate . . . . . . . . . . . . . . . 82 3 85 11 74 88
Commercial and industrial. . . . . . . . . . . . . . . . . . . . . . . . . . 515 278 793 75 718 862
Total commercial lending . . . . . . . . . . . . . . . . . . . . . . . . . 597 281 878 86 792 950
Small-ticket commercial real estate. . . . . . . . . . . . . . . . . . . 6 0 6 0 6 7
Total commercial banking. . . . . . . . . . . . . . . . . . . . . . . . . . . . . 603 281 884 86 798 957
Total . . . . . . . . . . . . . . . . . . . . . . . . . . . . . . . . . . . . . . . . . . . . . $ 1,822 $ 642 $ 2,464 $ 349 $ 2,115 $ 2,894