Capital One 2015 Annual Report Download - page 70
Download and view the complete annual report
Please find page 70 of the 2015 Capital One annual report below. You can navigate through the pages in the report by either clicking on the pages listed below, or by using the keyword search tool below to find specific information within the annual report.-
 1
1 -
2
-
3
-
4
-
5
-
6
-
7
-
8
-
9
-
10
-
11
-
12
-
13
-
14
-
15
-
16
-
17
-
18
-
19
-
20
-
21
-
22
-
23
-
24
-
25
-
26
-
27
-
28
-
29
-
30
-
31
-
32
-
33
-
34
-
35
-
36
-
37
-
38
-
39
-
40
-
41
-
42
-
43
-
44
-
45
-
46
-
47
-
48
-
49
-
50
-
51
-
52
-
53
-
54
-
55
-
56
-
57
-
58
-
59
-
 60
60 -
 61
61 -
 62
62 -
 63
63 -
 64
64 -
 65
65 -
 66
66 -
 67
67 -
 68
68 -
 69
69 -
 70
70 -
 71
71 -
 72
72 -
 73
73 -
 74
74 -
 75
75 -
 76
76 -
 77
77 -
 78
78 -
 79
79 -
 80
80 -
81
-
82
-
83
-
84
-
85
-
86
-
87
-
88
-
89
-
90
-
91
-
92
-
93
-
94
-
95
-
96
-
97
-
98
-
99
-
100
-
101
-
102
-
103
-
104
-
105
-
106
-
107
-
108
-
109
-
110
-
111
-
112
-
113
-
114
-
115
-
116
-
117
-
118
-
119
-
120
-
121
-
122
-
123
-
124
-
125
-
126
-
127
-
128
-
129
-
130
-
131
-
132
-
133
-
134
-
135
-
136
-
137
-
138
-
139
-
140
-
141
-
142
-
143
-
144
-
145
-
146
-
147
-
148
-
149
-
150
-
151
-
152
-
153
-
154
-
155
-
156
-
157
-
158
-
159
-
160
-
161
-
162
-
163
-
164
-
165
-
166
-
167
-
168
-
169
-
170
-
171
-
172
-
173
-
174
-
175
-
176
-
177
-
178
-
179
-
180
-
181
-
182
-
183
-
184
-
185
-
186
-
187
-
188
-
189
-
190
-
191
-
192
-
193
-
194
-
195
-
196
-
197
-
198
-
199
-
200
-
201
-
202
-
203
-
204
-
205
-
206
-
207
-
208
-
209
-
210
-
211
-
212
-
213
-
214
-
215
-
216
-
217
-
218
-
219
-
220
-
221
-
222
-
223
-
224
-
225
-
226
-
227
-
228
-
229
-
230
-
231
-
232
-
233
-
234
-
235
-
236
-
237
-
238
-
239
-
240
-
241
-
242
-
243
-
244
-
245
-
246
-
247
-
248
-
249
-
250
-
251
-
252
-
253
 |
 |

51 Capital One Financial Corporation (COF)
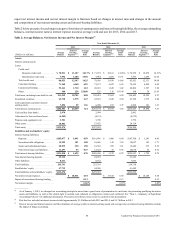
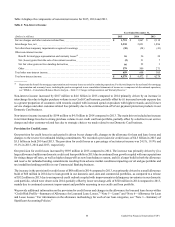
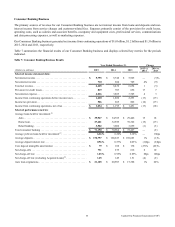
Credit Card Business
The primary sources of revenue for our Credit Card business are interest income, net interchange income and fees collected from
customers. Expenses primarily consist of the provision for credit losses, operating costs such as salaries and associate benefits,
occupancy and equipment, professional services, communications and data processing expenses and marketing expenses.
Our Credit Card business generated net income from continuing operations of $2.4 billion, $2.5 billion and $2.6 billion in 2015,
2014 and 2013, respectively.
Table 6 summarizes the financial results of our Credit Card business, which is comprised of Domestic Card and International Card,
and displays selected key metrics for the periods indicated.
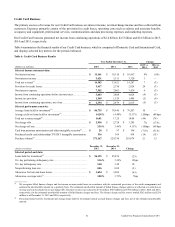
Table 6: Credit Card Business Results
Year Ended December 31, Change
(Dollars in millions) 2015 2014 2013 2015 vs.
2014
2014 vs.
2013
Selected income statement data:
Net interest income . . . . . . . . . . . . . . . . . . . . . . . . . . . . . . . . . . . . . . . . $ 11,161 $ 10,310 $ 10,967 8% (6)%
Non-interest income . . . . . . . . . . . . . . . . . . . . . . . . . . . . . . . . . . . . . . . 3,421 3,311 3,320 3 —
Total net revenue(1) . . . . . . . . . . . . . . . . . . . . . . . . . . . . . . . . . . . . . . . . 14,582 13,621 14,287 7 (5)
Provision for credit losses. . . . . . . . . . . . . . . . . . . . . . . . . . . . . . . . . . . 3,417 2,750 2,824 24 (3)
Non-interest expense. . . . . . . . . . . . . . . . . . . . . . . . . . . . . . . . . . . . . . . 7,502 7,063 7,439 6 (5)
Income from continuing operations before income taxes. . . . . . . . . . . 3,663 3,808 4,024 (4) (5)
Income tax provision. . . . . . . . . . . . . . . . . . . . . . . . . . . . . . . . . . . . . . . 1,309 1,329 1,409 (2) (6)
Income from continuing operations, net of tax. . . . . . . . . . . . . . . . . . . $ 2,354 $ 2,479 $ 2,615 (5) (5)
Selected performance metrics:
Average loans held for investment(2) . . . . . . . . . . . . . . . . . . . . . . . . . . . $ 86,735 $ 78,946 $ 79,207 10 —
Average yield on loans held for investment(3) . . . . . . . . . . . . . . . . . . . . 14.28% 14.48% 15.37% (20)bps (89)bps
Total net revenue margin(4) . . . . . . . . . . . . . . . . . . . . . . . . . . . . . . . . . . 16.81 17.25 18.04 (44) (79)
Net charge-offs . . . . . . . . . . . . . . . . . . . . . . . . . . . . . . . . . . . . . . . . . . . $ 2,918 $ 2,728 $ 3,285 7% (17)%
Net charge-off rate . . . . . . . . . . . . . . . . . . . . . . . . . . . . . . . . . . . . . . . . 3.36% 3.46% 4.15% (10)bps (69)bps
Card loan premium amortization and other intangible accretion(5). . . . $ 28 $ 97 $ 198 (71)% (51)%
Purchased credit card relationship (“PCCR”) intangible amortization.316 369 434 (14) (15)
Purchase volume(6) . . . . . . . . . . . . . . . . . . . . . . . . . . . . . . . . . . . . . . . . 271,167 224,750 201,074 21 12
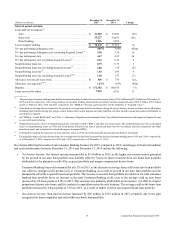
(Dollars in millions)
December 31,
2015
December 31,
2014 Change
Selected period-end data:
Loans held for investment(2) . . . . . . . . . . . . . . . . . . . . . . . . . . . . . . . . . $ 96,125 $ 85,876 12%
30+ day performing delinquency rate . . . . . . . . . . . . . . . . . . . . . . . . . . 3.36% 3.24% 12bps
30+ day delinquency rate . . . . . . . . . . . . . . . . . . . . . . . . . . . . . . . . . . . 3.40 3.30 10
Nonperforming loan rate. . . . . . . . . . . . . . . . . . . . . . . . . . . . . . . . . . . . 0.06 0.08 (2)
Allowance for loan and lease losses . . . . . . . . . . . . . . . . . . . . . . . . . . . $ 3,654 $ 3,204 14%
Allowance coverage ratio(7) . . . . . . . . . . . . . . . . . . . . . . . . . . . . . . . . . 3.80% 3.73% 7bps
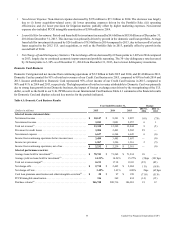
__________
(1) We recognize billed finance charges and fee income on open-ended loans in accordance with the contractual provisions of the credit arrangements and
estimate the uncollectible amount on a quarterly basis. The estimated uncollectible amount of billed finance charges and fees is reflected as a reduction in
revenue and is not included in our net charge-offs. Total net revenue was reduced by $732 million, $645 million and $796 million in 2015, 2014 and 2013,
respectively, for the estimated uncollectible amount of billed finance charges and fees. The finance charge and fee reserve totaled $262 million and $216
million as of December 31, 2015 and 2014, respectively.
(2) Period-end loans held for investment and average loans held for investment include accrued finance charges and fees, net of the estimated uncollectible
amount.