Capital One 2015 Annual Report Download - page 74
Download and view the complete annual report
Please find page 74 of the 2015 Capital One annual report below. You can navigate through the pages in the report by either clicking on the pages listed below, or by using the keyword search tool below to find specific information within the annual report.-
 1
1 -
2
-
3
-
4
-
5
-
6
-
7
-
8
-
9
-
10
-
11
-
12
-
13
-
14
-
15
-
16
-
17
-
18
-
19
-
20
-
21
-
22
-
23
-
24
-
25
-
26
-
27
-
28
-
29
-
30
-
31
-
32
-
33
-
34
-
35
-
36
-
37
-
38
-
39
-
40
-
41
-
42
-
43
-
44
-
45
-
46
-
47
-
48
-
49
-
50
-
51
-
52
-
53
-
54
-
55
-
56
-
57
-
58
-
59
-
60
-
61
-
62
-
63
-
 64
64 -
 65
65 -
 66
66 -
 67
67 -
 68
68 -
 69
69 -
 70
70 -
 71
71 -
 72
72 -
 73
73 -
 74
74 -
 75
75 -
 76
76 -
 77
77 -
 78
78 -
 79
79 -
 80
80 -
 81
81 -
 82
82 -
 83
83 -
 84
84 -
85
-
86
-
87
-
88
-
89
-
90
-
91
-
92
-
93
-
94
-
95
-
96
-
97
-
98
-
99
-
100
-
101
-
102
-
103
-
104
-
105
-
106
-
107
-
108
-
109
-
110
-
111
-
112
-
113
-
114
-
115
-
116
-
117
-
118
-
119
-
120
-
121
-
122
-
123
-
124
-
125
-
126
-
127
-
128
-
129
-
130
-
131
-
132
-
133
-
134
-
135
-
136
-
137
-
138
-
139
-
140
-
141
-
142
-
143
-
144
-
145
-
146
-
147
-
148
-
149
-
150
-
151
-
152
-
153
-
154
-
155
-
156
-
157
-
158
-
159
-
160
-
161
-
162
-
163
-
164
-
165
-
166
-
167
-
168
-
169
-
170
-
171
-
172
-
173
-
174
-
175
-
176
-
177
-
178
-
179
-
180
-
181
-
182
-
183
-
184
-
185
-
186
-
187
-
188
-
189
-
190
-
191
-
192
-
193
-
194
-
195
-
196
-
197
-
198
-
199
-
200
-
201
-
202
-
203
-
204
-
205
-
206
-
207
-
208
-
209
-
210
-
211
-
212
-
213
-
214
-
215
-
216
-
217
-
218
-
219
-
220
-
221
-
222
-
223
-
224
-
225
-
226
-
227
-
228
-
229
-
230
-
231
-
232
-
233
-
234
-
235
-
236
-
237
-
238
-
239
-
240
-
241
-
242
-
243
-
244
-
245
-
246
-
247
-
248
-
249
-
250
-
251
-
252
-
253
 |
 |

55 Capital One Financial Corporation (COF)
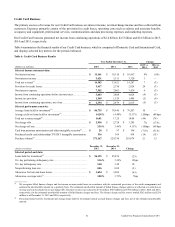
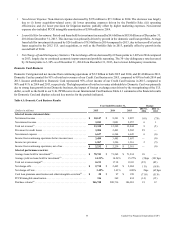
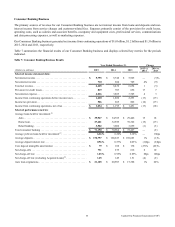
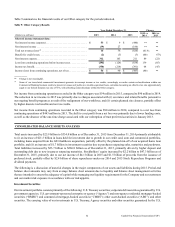
Table 6.2 summarizes the financial results for International Card and displays selected key metrics for the periods indicated.
Table 6.2: International Card Business Results
Year Ended December 31, Change
(Dollars in millions) 2015 2014 2013 2015 vs.
2014
2014 vs.
2013
Selected income statement data:
Net interest income . . . . . . . . . . . . . . . . . . . . . . . . . . . . . . . . . . . . . . . $ 1,014 $ 1,069 $ 1,080 (5)% (1)%
Non-interest income. . . . . . . . . . . . . . . . . . . . . . . . . . . . . . . . . . . . . . . 238 310 363 (23) (15)
Total net revenue . . . . . . . . . . . . . . . . . . . . . . . . . . . . . . . . . . . . . . . . . 1,252 1,379 1,443 (9) (4)
Provision for credit losses . . . . . . . . . . . . . . . . . . . . . . . . . . . . . . . . . . 213 257 322 (17) (20)
Non-interest expense . . . . . . . . . . . . . . . . . . . . . . . . . . . . . . . . . . . . . . 875 799 794 10 1
Income from continuing operations before income taxes . . . . . . . . . . 164 323 327 (49) (1)
Income tax provision . . . . . . . . . . . . . . . . . . . . . . . . . . . . . . . . . . . . . . 42 83 93 (49) (11)
Income from continuing operations, net of tax . . . . . . . . . . . . . . . . . . $ 122 $ 240 $ 234 (49) 3
Selected performance metrics:
Average loans held for investment(1) . . . . . . . . . . . . . . . . . . . . . . . . . . $ 7,992 $ 7,684 $ 7,973 4 (4)
Average yield on loans held for investment(2) . . . . . . . . . . . . . . . . . . . 15.02% 16.53% 16.24% (151)bps 29bps
Total net revenue margin(3). . . . . . . . . . . . . . . . . . . . . . . . . . . . . . . . . . 15.66 17.95 18.10 (229) (15)
Net charge-offs. . . . . . . . . . . . . . . . . . . . . . . . . . . . . . . . . . . . . . . . . . . $ 200 $ 283 $ 381 (29)% (26)%
Net charge-off rate . . . . . . . . . . . . . . . . . . . . . . . . . . . . . . . . . . . . . . . . 2.50% 3.69% 4.78% (119)bps (109)bps
Purchase volume(4) . . . . . . . . . . . . . . . . . . . . . . . . . . . . . . . . . . . . . . . . $ 24,427 $ 16,034 $ 14,173 52% 13 %
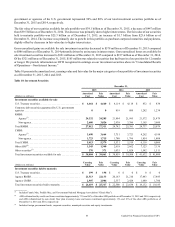
(Dollars in millions)
December 31,
2015
December 31,
2014 Change
Selected period-end data:
Loans held for investment(1) . . . . . . . . . . . . . . . . . . . . . . . . . . . . . . . . . $ 8,186 $ 8,172 —
30+ day performing delinquency rate . . . . . . . . . . . . . . . . . . . . . . . . . 2.98% 2.94% 4bps
30+ day delinquency rate . . . . . . . . . . . . . . . . . . . . . . . . . . . . . . . . . . . 3.46 3.60 (14)
Nonperforming loan rate . . . . . . . . . . . . . . . . . . . . . . . . . . . . . . . . . . . 0.65 0.86 (21)
Allowance for loan and lease losses. . . . . . . . . . . . . . . . . . . . . . . . . . . $ 299 $ 326 (8)%
Allowance coverage ratio(5) . . . . . . . . . . . . . . . . . . . . . . . . . . . . . . . . . 3.66% 3.99% (33)bps
__________
(1) Period-end loans held for investment and average loans held for investment include accrued finance charges and fees, net of the estimated uncollectible
amount.
(2) Calculated by dividing interest income for the period by average loans held for investment during the period. Interest income excludes various allocations
including funds transfer pricing that assigns certain balance sheet assets, deposits and other liabilities and their related revenue and expenses attributable to
each business segment.
(3) Calculated by dividing total net revenue for the period by average loans held for investment during the period.
(4) Consists of international card purchase transactions, net of returns for the period. Excludes cash advance and balance transfer transactions.
(5) Calculated by dividing the allowance for loan and lease losses as of the end of the period by period-end loans held for investment.