Capital One 2015 Annual Report Download - page 242
Download and view the complete annual report
Please find page 242 of the 2015 Capital One annual report below. You can navigate through the pages in the report by either clicking on the pages listed below, or by using the keyword search tool below to find specific information within the annual report.-
 1
1 -
2
-
3
-
4
-
5
-
6
-
7
-
8
-
9
-
10
-
11
-
12
-
13
-
14
-
15
-
16
-
17
-
18
-
19
-
20
-
21
-
22
-
23
-
24
-
25
-
26
-
27
-
28
-
29
-
30
-
31
-
32
-
33
-
34
-
35
-
36
-
37
-
38
-
39
-
40
-
41
-
42
-
43
-
44
-
45
-
46
-
47
-
48
-
49
-
50
-
51
-
52
-
53
-
54
-
55
-
56
-
57
-
58
-
59
-
60
-
61
-
62
-
63
-
64
-
65
-
66
-
67
-
68
-
69
-
70
-
71
-
72
-
73
-
74
-
75
-
76
-
77
-
78
-
79
-
80
-
81
-
82
-
83
-
84
-
85
-
86
-
87
-
88
-
89
-
90
-
91
-
92
-
93
-
94
-
95
-
96
-
97
-
98
-
99
-
100
-
101
-
102
-
103
-
104
-
105
-
106
-
107
-
108
-
109
-
110
-
111
-
112
-
113
-
114
-
115
-
116
-
117
-
118
-
119
-
120
-
121
-
122
-
123
-
124
-
125
-
126
-
127
-
128
-
129
-
130
-
131
-
132
-
133
-
134
-
135
-
136
-
137
-
138
-
139
-
140
-
141
-
142
-
143
-
144
-
145
-
146
-
147
-
148
-
149
-
150
-
151
-
152
-
153
-
154
-
155
-
156
-
157
-
158
-
159
-
160
-
161
-
162
-
163
-
164
-
165
-
166
-
167
-
168
-
169
-
170
-
171
-
172
-
173
-
174
-
175
-
176
-
177
-
178
-
179
-
180
-
181
-
182
-
183
-
184
-
185
-
186
-
187
-
188
-
189
-
190
-
191
-
192
-
193
-
194
-
195
-
196
-
197
-
198
-
199
-
200
-
201
-
202
-
203
-
204
-
205
-
206
-
207
-
208
-
209
-
210
-
211
-
212
-
213
-
214
-
215
-
216
-
217
-
218
-
219
-
220
-
221
-
222
-
223
-
224
-
225
-
226
-
227
-
228
-
229
-
230
-
231
-
 232
232 -
 233
233 -
 234
234 -
 235
235 -
 236
236 -
 237
237 -
 238
238 -
 239
239 -
 240
240 -
 241
241 -
 242
242 -
 243
243 -
 244
244 -
 245
245 -
 246
246 -
 247
247 -
 248
248 -
 249
249 -
 250
250 -
 251
251 -
 252
252 -
253
 |
 |

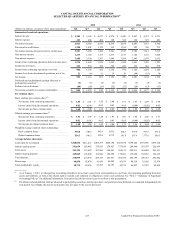
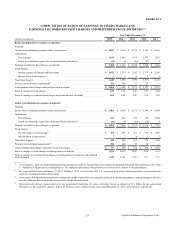
CAPITAL ONE FINANCIAL CORPORATION
SELECTED QUARTERLY FINANCIAL INFORMATION(1)
223 Capital One Financial Corporation (COF)
(Dollars in millions, except per share data) (unaudited)
2015 2014
Q4 Q3 Q2 Q1 Q4 Q3 Q2 Q1
Summarized results of operations:
Interest income . . . . . . . . . . . . . . . . . . . . . . . . . . . . . . . . . . $ 5,384 $ 5,164 $ 4,937 $ 4,974 $ 5,045 $ 4,887 $ 4,712 $ 4,753
Interest expense . . . . . . . . . . . . . . . . . . . . . . . . . . . . . . . . . . 423 404 400 398 389 390 397 403
Net interest income . . . . . . . . . . . . . . . . . . . . . . . . . . . . . . . 4,961 4,760 4,537 4,576 4,656 4,497 4,315 4,350
Provision for credit losses . . . . . . . . . . . . . . . . . . . . . . . . . . 1,380 1,092 1,129 935 1,109 993 704 735
Net interest income after provision for credit losses. . . . . . 3,581 3,668 3,408 3,641 3,547 3,504 3,611 3,615
Non-interest income . . . . . . . . . . . . . . . . . . . . . . . . . . . . . . 1,233 1,140 1,135 1,071 1,157 1,142 1,153 1,020
Non-interest expense . . . . . . . . . . . . . . . . . . . . . . . . . . . . . . 3,480 3,160 3,307 3,049 3,284 2,985 2,979 2,932
Income from continuing operations before income taxes . . 1,334 1,648 1,236 1,663 1,420 1,661 1,785 1,703
Income tax provision . . . . . . . . . . . . . . . . . . . . . . . . . . . . . . 426 530 384 529 450 536 581 579
Income from continuing operations, net of tax . . . . . . . . . . 908 1,118 852 1,134 970 1,125 1,204 1,124
Income (loss) from discontinued operations, net of tax 12 (4) 11 19 29 (44) (10) 30
Net income . . . . . . . . . . . . . . . . . . . . . . . . . . . . . . . . . . . . . 920 1,114 863 1,153 999 1,081 1,194 1,154
Dividends and undistributed earnings allocated to
participating securities(2) . . . . . . . . . . . . . . . . . . . . . . . . . . . (4) (6) (4) (6) (4) (5) (4) (5)
Preferred stock dividends . . . . . . . . . . . . . . . . . . . . . . . . . . (68) (29) (29) (32) (21) (20) (13) (13)
Net income available to common stockholders. . . . . . . . . . $ 848 $ 1,079 $ 830 $ 1,115 $ 974 $ 1,056 $ 1,177 $ 1,136
Per common share:
Basic earnings per common share:(2)
Net income from continuing operations . . . . . . . . . . . . $ 1.58 $ 2.01 $ 1.50 $ 2.00 $ 1.71 $ 1.97 $ 2.09 $ 1.94
Income (loss) from discontinued operations . . . . . . . . . 0.02 (0.01) 0.02 0.03 0.05 (0.08) (0.02) 0.05
Net income per basic common share. . . . . . . . . . . . . . . $ 1.60 $ 2.00 $ 1.52 $ 2.03 $ 1.76 $ 1.89 $ 2.07 $ 1.99
Diluted earnings per common share:(2)
Net income from continuing operations . . . . . . . . . . . . $ 1.56 $ 1.99 $ 1.48 $ 1.97 $ 1.68 $ 1.94 $ 2.06 $ 1.91
Income (loss) from discontinued operations . . . . . . . . . 0.02 (0.01) 0.02 0.03 0.05 (0.08) (0.02) 0.05
Net income per diluted common share . . . . . . . . . . . . . $ 1.58 $ 1.98 $ 1.50 $ 2.00 $ 1.73 $ 1.86 $ 2.04 $ 1.96
Weighted average common shares outstanding:
Basic common shares . . . . . . . . . . . . . . . . . . . . . . . . . . 530.8 540.6 545.6 550.2 554.3 559.9 567.5 571.0
Diluted common shares . . . . . . . . . . . . . . . . . . . . . . . . . 536.3 546.3 552.0 557.2 561.8 567.9 577.6 580.3
Average balance sheet data:
Loans held for investment . . . . . . . . . . . . . . . . . . . . . . . . . . $220,052 $211,227 $206,337 $205,194 $203,436 $199,422 $194,996 $193,722
Interest-earning assets . . . . . . . . . . . . . . . . . . . . . . . . . . . . . 292,054 283,082 276,585 278,427 273,436 268,890 263,570 262,659
Total assets. . . . . . . . . . . . . . . . . . . . . . . . . . . . . . . . . . . . . . 323,354 313,822 307,206 309,401 304,153 298,913 294,089 293,551
Interest-bearing deposits . . . . . . . . . . . . . . . . . . . . . . . . . . . 189,885 185,800 183,946 182,998 179,401 179,928 182,053 184,183
Total deposits. . . . . . . . . . . . . . . . . . . . . . . . . . . . . . . . . . . . 215,899 210,974 209,143 207,851 205,355 205,199 206,315 205,842
Borrowings . . . . . . . . . . . . . . . . . . . . . . . . . . . . . . . . . . . . . 48,850 45,070 41,650 46,082 43,479 40,314 35,658 35,978
Total stockholders’ equity . . . . . . . . . . . . . . . . . . . . . . . . . . 48,712 48,456 47,255 46,397 45,576 44,827 43,767 42,859
__________
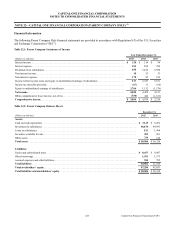
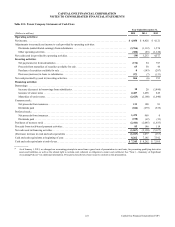
(1) As of January 1, 2015, we changed our accounting principle to move from a gross basis of presentation to a net basis, for presenting qualifying derivative
assets and liabilities, as well as the related right to reclaim cash collateral or obligation to return cash collateral. See “Note 1—Summary of Significant
Accounting Policies” for additional information. Prior period results have been recast to conform to this presentation.
(2.) Dividends and undistributed earnings allocated to participating securities, earnings per share, and preferred stock dividends are computed independently for
each period. Accordingly, the sum of each quarter may not agree to the year-to-date total.