Capital One 2015 Annual Report Download - page 220
Download and view the complete annual report
Please find page 220 of the 2015 Capital One annual report below. You can navigate through the pages in the report by either clicking on the pages listed below, or by using the keyword search tool below to find specific information within the annual report.-
 1
1 -
2
-
3
-
4
-
5
-
6
-
7
-
8
-
9
-
10
-
11
-
12
-
13
-
14
-
15
-
16
-
17
-
18
-
19
-
20
-
21
-
22
-
23
-
24
-
25
-
26
-
27
-
28
-
29
-
30
-
31
-
32
-
33
-
34
-
35
-
36
-
37
-
38
-
39
-
40
-
41
-
42
-
43
-
44
-
45
-
46
-
47
-
48
-
49
-
50
-
51
-
52
-
53
-
54
-
55
-
56
-
57
-
58
-
59
-
60
-
61
-
62
-
63
-
64
-
65
-
66
-
67
-
68
-
69
-
70
-
71
-
72
-
73
-
74
-
75
-
76
-
77
-
78
-
79
-
80
-
81
-
82
-
83
-
84
-
85
-
86
-
87
-
88
-
89
-
90
-
91
-
92
-
93
-
94
-
95
-
96
-
97
-
98
-
99
-
100
-
101
-
102
-
103
-
104
-
105
-
106
-
107
-
108
-
109
-
110
-
111
-
112
-
113
-
114
-
115
-
116
-
117
-
118
-
119
-
120
-
121
-
122
-
123
-
124
-
125
-
126
-
127
-
128
-
129
-
130
-
131
-
132
-
133
-
134
-
135
-
136
-
137
-
138
-
139
-
140
-
141
-
142
-
143
-
144
-
145
-
146
-
147
-
148
-
149
-
150
-
151
-
152
-
153
-
154
-
155
-
156
-
157
-
158
-
159
-
160
-
161
-
162
-
163
-
164
-
165
-
166
-
167
-
168
-
169
-
170
-
171
-
172
-
173
-
174
-
175
-
176
-
177
-
178
-
179
-
180
-
181
-
182
-
183
-
184
-
185
-
186
-
187
-
188
-
189
-
190
-
191
-
192
-
193
-
194
-
195
-
196
-
197
-
198
-
199
-
200
-
201
-
202
-
203
-
204
-
205
-
206
-
207
-
208
-
209
-
 210
210 -
 211
211 -
 212
212 -
 213
213 -
 214
214 -
 215
215 -
 216
216 -
 217
217 -
 218
218 -
 219
219 -
 220
220 -
 221
221 -
 222
222 -
 223
223 -
 224
224 -
 225
225 -
 226
226 -
 227
227 -
 228
228 -
 229
229 -
 230
230 -
231
-
232
-
233
-
234
-
235
-
236
-
237
-
238
-
239
-
240
-
241
-
242
-
243
-
244
-
245
-
246
-
247
-
248
-
249
-
250
-
251
-
252
-
253
 |
 |

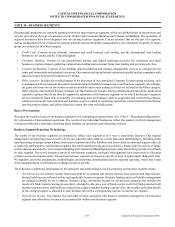
CAPITAL ONE FINANCIAL CORPORATION
NOTES TO CONSOLIDATED FINANCIAL STATEMENTS
201 Capital One Financial Corporation (COF)
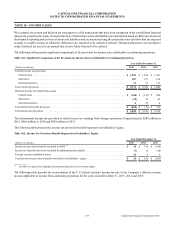
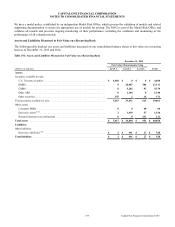
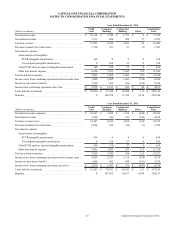
Table 19.2: Level 3 Recurring Fair Value Rollforward
Fair Value Measurements Using Significant Unobservable Inputs (Level 3)
Year Ended December 31, 2015
Total Gains (Losses)
(Realized/Unrealized)
Net Unrealized
Gains (Losses)
Included in Net
Income Related to
Assets and
Liabilities
Still Held as of
Dcember 31, 2015(3)
(Dollars in millions)
Balance,
January 1,
2015
Included
in Net
Income(1)
Included
in
OCI Purchases Sales Issuances Settlements
Transfers
Into
Level 3(2)
Transfers
Out of
Level 3(2)
Balance,
December
31, 2015
Assets:
Securities available for sale:
Corporate debt securities
guaranteed by U.S.
government agencies . . . . $ 333 $ (1) $ 6 $ 0 $(226) $ 0 $ (12) $ 0 $ (100) $ 0 $ 0
RMBS . . . . . . . . . . . . . . . 561 35 (3) 0 0 0 (63) 343 (369) 504 36
CMBS . . . . . . . . . . . . . . . 228 0 (1) 138 0 0 (52) 0 (216) 97 0
Other ABS . . . . . . . . . . . . 65 1 (2) 0 (20) 0 0 0 (44) 0 0
Other securities . . . . . . . . 18 0 0 4 0 0 (8) 0 0 14 0
Total securities available
for sale . . . . . . . . . . . . . . . 1,205 35 0 142 (246) 0 (135) 343 (729) 615 36
Other assets:
Consumer MSRs . . . . . . . 53 (1) 0 0 0 22 (6) 0 0 68 (1)
Derivative assets(4) . . . . . . 66 14 0 0 0 49 (59) 0 (13) 57 14
Retained interest in
securitizations . . . . . . . . . 221 (10) 0 0 0 0 0 0 0 211 (10)
Liabilities:
Other liabilities:
Derivative liabilities(4) . . . $ (43) $ (9) $ 0 $ 0 $ 0 $ (20) $ 36 $ 0 $ 9 $ (27) $ (9)
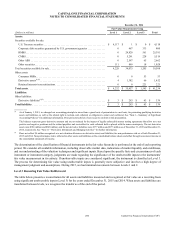
Fair Value Measurements Using Significant Unobservable Inputs (Level 3)
Year Ended December 31, 2014
Total Gains (Losses)
(Realized/Unrealized)
Net Unrealized
Gains (Losses)
Included in Net
Income Related to
Assets and Liabilities
Still Held as of
December 31, 2014(3)
(Dollars in millions)
Balance,
January 1,
2014
Included
in Net
Income(1)
Included
in
OCI Purchases Sales Issuances Settlements
Transfers
Into
Level 3(2)
Transfers
Out of
Level 3(2)
Balance,
December
31, 2014
Assets:
Securities available for sale:
Corporate debt securities
guaranteed by U.S.
government agencies . . . . $ 927 $ (5) $ 20 $ 0 $(248) $ 0 $ (63) $ 64 $ (362) $ 333 $ 0
RMBS . . . . . . . . . . . . . . . 1,304 65 39 1,022 0 0 (171) 259 (1,957) 561 64
CMBS . . . . . . . . . . . . . . . 739 0 3 192 0 0 (75) 66 (697) 228 0
Other ABS . . . . . . . . . . . . 343 5 12 0 0 0 (3) 75 (367) 65 5
Other securities . . . . . . . . 17 (1) 0 0 0 0 (8) 10 0 18 0
Total securities available
for sale . . . . . . . . . . . . . . . 3,330 64 74 1,214 (248) 0 (320) 474 (3,383) 1,205 69
Other assets:
Consumer MSRs . . . . . . . 69 (27) 0 0 0 15 (4) 0 0 53 (27)
Derivative assets(4) . . . . . . 50 20 0 0 0 20 (21) 0 (3) 66 19
Retained interest in
securitization . . . . . . . . . . 199 22 0 0 0 0 0 0 0 221 22
Liabilities:
Other liabilities:
Derivative liabilities(4) . . . $ (38) $ (20) $ 0 $ 0 $ 0 $ (15) $ 29 $ 0 $ 1 $ (43) $ (20)
__________
(1) Gains (losses) related to Level 3 Consumer MSRs, derivative assets and derivative liabilities, and retained interests in securitizations are reported in other
non-interest income, which is a component of non-interest income, in our consolidated statements of income.
(2) During the years ended December 31, 2015 and 2014, the transfers into Level 3 were primarily driven by less consistency among vendor pricing on individual
securities, while the transfers out of Level 3 for 2015 and 2014 were primarily driven by greater consistency among multiple pricing sources.