Capital One 2015 Annual Report Download - page 166
Download and view the complete annual report
Please find page 166 of the 2015 Capital One annual report below. You can navigate through the pages in the report by either clicking on the pages listed below, or by using the keyword search tool below to find specific information within the annual report.-
 1
1 -
2
-
3
-
4
-
5
-
6
-
7
-
8
-
9
-
10
-
11
-
12
-
13
-
14
-
15
-
16
-
17
-
18
-
19
-
20
-
21
-
22
-
23
-
24
-
25
-
26
-
27
-
28
-
29
-
30
-
31
-
32
-
33
-
34
-
35
-
36
-
37
-
38
-
39
-
40
-
41
-
42
-
43
-
44
-
45
-
46
-
47
-
48
-
49
-
50
-
51
-
52
-
53
-
54
-
55
-
56
-
57
-
58
-
59
-
60
-
61
-
62
-
63
-
64
-
65
-
66
-
67
-
68
-
69
-
70
-
71
-
72
-
73
-
74
-
75
-
76
-
77
-
78
-
79
-
80
-
81
-
82
-
83
-
84
-
85
-
86
-
87
-
88
-
89
-
90
-
91
-
92
-
93
-
94
-
95
-
96
-
97
-
98
-
99
-
100
-
101
-
102
-
103
-
104
-
105
-
106
-
107
-
108
-
109
-
110
-
111
-
112
-
113
-
114
-
115
-
116
-
117
-
118
-
119
-
120
-
121
-
122
-
123
-
124
-
125
-
126
-
127
-
128
-
129
-
130
-
131
-
132
-
133
-
134
-
135
-
136
-
137
-
138
-
139
-
140
-
141
-
142
-
143
-
144
-
145
-
146
-
147
-
148
-
149
-
150
-
151
-
152
-
153
-
154
-
155
-
 156
156 -
 157
157 -
 158
158 -
 159
159 -
 160
160 -
 161
161 -
 162
162 -
 163
163 -
 164
164 -
 165
165 -
 166
166 -
 167
167 -
 168
168 -
 169
169 -
 170
170 -
 171
171 -
 172
172 -
 173
173 -
 174
174 -
 175
175 -
 176
176 -
177
-
178
-
179
-
180
-
181
-
182
-
183
-
184
-
185
-
186
-
187
-
188
-
189
-
190
-
191
-
192
-
193
-
194
-
195
-
196
-
197
-
198
-
199
-
200
-
201
-
202
-
203
-
204
-
205
-
206
-
207
-
208
-
209
-
210
-
211
-
212
-
213
-
214
-
215
-
216
-
217
-
218
-
219
-
220
-
221
-
222
-
223
-
224
-
225
-
226
-
227
-
228
-
229
-
230
-
231
-
232
-
233
-
234
-
235
-
236
-
237
-
238
-
239
-
240
-
241
-
242
-
243
-
244
-
245
-
246
-
247
-
248
-
249
-
250
-
251
-
252
-
253
 |
 |

CAPITAL ONE FINANCIAL CORPORATION
NOTES TO CONSOLIDATED FINANCIAL STATEMENTS
147 Capital One Financial Corporation (COF)
December 31, 2015 December 31, 2014
(Dollars in millions)
> 90 Days
and Accruing
Nonperforming
Loans
> 90 Days
and Accruing
Nonperforming
Loans
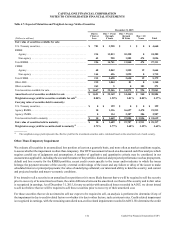
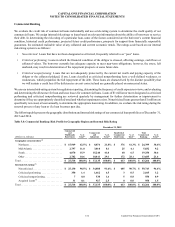
Commercial Banking:
Commercial and multifamily real estate . . . . . . . . . . . . . . . . . . . . . . . . 0 7 7 62
Commercial and industrial . . . . . . . . . . . . . . . . . . . . . . . . . . . . . . . . . . 5 538 1 106
Total commercial lending. . . . . . . . . . . . . . . . . . . . . . . . . . . . . . . . . . 5 545 8 168
Small-ticket commercial real estate . . . . . . . . . . . . . . . . . . . . . . . . . . . 0 5 0 7
Total commercial banking . . . . . . . . . . . . . . . . . . . . . . . . . . . . . . . . . . . . . 5 550 8 175
Other loans . . . . . . . . . . . . . . . . . . . . . . . . . . . . . . . . . . . . . . . . . . . . . . . . . 0 9 0 15
Total . . . . . . . . . . . . . . . . . . . . . . . . . . . . . . . . . . . . . . . . . . . . . . . . . . . . . . $ 1,505 $ 1,170 $ 1,263 $ 809
% of Total loans . . . . . . . . . . . . . . . . . . . . . . . . . . . . . . . . . . . . . . . . . . . . . 0.65% 0.51% 0.61% 0.39%
__________
(1) Nonperforming loans generally include loans that have been placed on nonaccrual status. Acquired Loans are excluded from loans reported as 90 days and
accruing interest as well as nonperforming loans. See “Note 1—Summary of Significant Accounting Policies” for additional information on our policies for
non-performing loans classification.
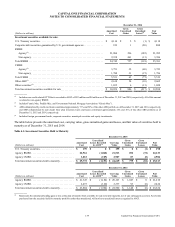
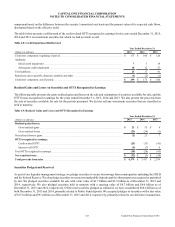
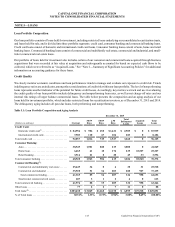
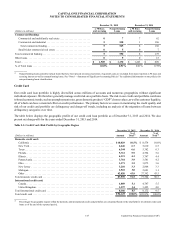
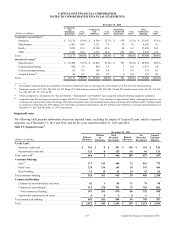
Credit Card
Our credit card loan portfolio is highly diversified across millions of accounts and numerous geographies without significant
individual exposure. We therefore generally manage credit risk on a portfolio basis. The risk in our credit card portfolio correlates
to broad economic trends, such as unemployment rates, gross domestic product (“GDP”), home values, as well as customer liquidity,
all of which can have a material effect on credit performance. The primary factors we assess in monitoring the credit quality and
risk of our credit card portfolio are delinquency and charge-off trends, including an analysis of the migration of loans between
delinquency categories over time.
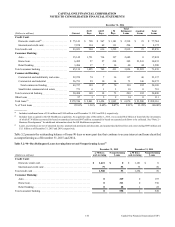
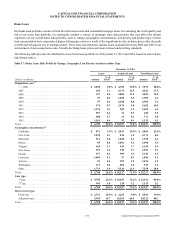
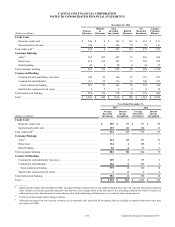
The table below displays the geographic profile of our credit card loan portfolio as of December 31, 2015 and 2014. We also
present net charge-offs for the years ended December 31, 2015 and 2014.
Table 5.3: Credit Card: Risk Profile by Geographic Region
December 31, 2015 December 31, 2014
(Dollars in millions) Amount
% of
Total(1) Amount
% of
Total(1)
Domestic credit card:
California . . . . . . . . . . . . . . . . . . . . . . . . . . . . . . . . . . . . . . . . . . . . . . . . . . . . . . . . . . . . . . . . . $ 10,029 10.5% $ 8,574 10.0%
New York . . . . . . . . . . . . . . . . . . . . . . . . . . . . . . . . . . . . . . . . . . . . . . . . . . . . . . . . . . . . . . . . . 6,446 6.7 5,610 6.5
Texas . . . . . . . . . . . . . . . . . . . . . . . . . . . . . . . . . . . . . . . . . . . . . . . . . . . . . . . . . . . . . . . . . . . . . 6,344 6.6 5,382 6.3
Florida . . . . . . . . . . . . . . . . . . . . . . . . . . . . . . . . . . . . . . . . . . . . . . . . . . . . . . . . . . . . . . . . . . . . 5,712 5.9 4,794 5.6
Illinois . . . . . . . . . . . . . . . . . . . . . . . . . . . . . . . . . . . . . . . . . . . . . . . . . . . . . . . . . . . . . . . . . . . . 4,121 4.3 3,747 4.4
Pennsylvania . . . . . . . . . . . . . . . . . . . . . . . . . . . . . . . . . . . . . . . . . . . . . . . . . . . . . . . . . . . . . . . 3,764 3.9 3,581 4.2
Ohio. . . . . . . . . . . . . . . . . . . . . . . . . . . . . . . . . . . . . . . . . . . . . . . . . . . . . . . . . . . . . . . . . . . . . . 3,371 3.5 3,075 3.6
New Jersey . . . . . . . . . . . . . . . . . . . . . . . . . . . . . . . . . . . . . . . . . . . . . . . . . . . . . . . . . . . . . . . . 3,210 3.3 2,868 3.3
Michigan . . . . . . . . . . . . . . . . . . . . . . . . . . . . . . . . . . . . . . . . . . . . . . . . . . . . . . . . . . . . . . . . . . 2,922 3.0 2,681 3.1
Other . . . . . . . . . . . . . . . . . . . . . . . . . . . . . . . . . . . . . . . . . . . . . . . . . . . . . . . . . . . . . . . . . . . . . 42,020 43.8 37,392 43.5
Total domestic credit card . . . . . . . . . . . . . . . . . . . . . . . . . . . . . . . . . . . . . . . . . . . . . . . . . . . . . . . 87,939 91.5 77,704 90.5
International credit card:
Canada. . . . . . . . . . . . . . . . . . . . . . . . . . . . . . . . . . . . . . . . . . . . . . . . . . . . . . . . . . . . . . . . . . . . 4,889 5.1 4,747 5.5
United Kingdom . . . . . . . . . . . . . . . . . . . . . . . . . . . . . . . . . . . . . . . . . . . . . . . . . . . . . . . . . . . . 3,297 3.4 3,425 4.0
Total international credit card. . . . . . . . . . . . . . . . . . . . . . . . . . . . . . . . . . . . . . . . . . . . . . . . . . . . . 8,186 8.5 8,172 9.5
Total credit card . . . . . . . . . . . . . . . . . . . . . . . . . . . . . . . . . . . . . . . . . . . . . . . . . . . . . . . . . . . . . . . $ 96,125 100.0% $ 85,876 100.0%
__________
(1) Percentages by geographic region within the domestic and international credit card portfolios are calculated based on the total held for investment credit card
loans as of the end of the reported period.