Capital One 2015 Annual Report Download - page 76
Download and view the complete annual report
Please find page 76 of the 2015 Capital One annual report below. You can navigate through the pages in the report by either clicking on the pages listed below, or by using the keyword search tool below to find specific information within the annual report.-
 1
1 -
2
-
3
-
4
-
5
-
6
-
7
-
8
-
9
-
10
-
11
-
12
-
13
-
14
-
15
-
16
-
17
-
18
-
19
-
20
-
21
-
22
-
23
-
24
-
25
-
26
-
27
-
28
-
29
-
30
-
31
-
32
-
33
-
34
-
35
-
36
-
37
-
38
-
39
-
40
-
41
-
42
-
43
-
44
-
45
-
46
-
47
-
48
-
49
-
50
-
51
-
52
-
53
-
54
-
55
-
56
-
57
-
58
-
59
-
60
-
61
-
62
-
63
-
64
-
65
-
 66
66 -
 67
67 -
 68
68 -
 69
69 -
 70
70 -
 71
71 -
 72
72 -
 73
73 -
 74
74 -
 75
75 -
 76
76 -
 77
77 -
 78
78 -
 79
79 -
 80
80 -
 81
81 -
 82
82 -
 83
83 -
 84
84 -
 85
85 -
 86
86 -
87
-
88
-
89
-
90
-
91
-
92
-
93
-
94
-
95
-
96
-
97
-
98
-
99
-
100
-
101
-
102
-
103
-
104
-
105
-
106
-
107
-
108
-
109
-
110
-
111
-
112
-
113
-
114
-
115
-
116
-
117
-
118
-
119
-
120
-
121
-
122
-
123
-
124
-
125
-
126
-
127
-
128
-
129
-
130
-
131
-
132
-
133
-
134
-
135
-
136
-
137
-
138
-
139
-
140
-
141
-
142
-
143
-
144
-
145
-
146
-
147
-
148
-
149
-
150
-
151
-
152
-
153
-
154
-
155
-
156
-
157
-
158
-
159
-
160
-
161
-
162
-
163
-
164
-
165
-
166
-
167
-
168
-
169
-
170
-
171
-
172
-
173
-
174
-
175
-
176
-
177
-
178
-
179
-
180
-
181
-
182
-
183
-
184
-
185
-
186
-
187
-
188
-
189
-
190
-
191
-
192
-
193
-
194
-
195
-
196
-
197
-
198
-
199
-
200
-
201
-
202
-
203
-
204
-
205
-
206
-
207
-
208
-
209
-
210
-
211
-
212
-
213
-
214
-
215
-
216
-
217
-
218
-
219
-
220
-
221
-
222
-
223
-
224
-
225
-
226
-
227
-
228
-
229
-
230
-
231
-
232
-
233
-
234
-
235
-
236
-
237
-
238
-
239
-
240
-
241
-
242
-
243
-
244
-
245
-
246
-
247
-
248
-
249
-
250
-
251
-
252
-
253
 |
 |

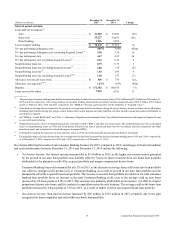
57 Capital One Financial Corporation (COF)
(Dollars in millions)
December 31,
2015
December 31,
2014 Change
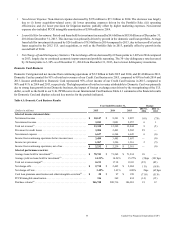
Selected period-end data:
Loans held for investment:(1)
Auto . . . . . . . . . . . . . . . . . . . . . . . . . . . . . . . . . . . . . . . . . . . . . . . . . $ 41,549 $ 37,824 10%
Home loan . . . . . . . . . . . . . . . . . . . . . . . . . . . . . . . . . . . . . . . . . . . . 25,227 30,035 (16)
Retail banking . . . . . . . . . . . . . . . . . . . . . . . . . . . . . . . . . . . . . . . . . 3,596 3,580 —
Total consumer banking . . . . . . . . . . . . . . . . . . . . . . . . . . . . . . . . . . . . $ 70,372 $ 71,439 (1)
30+ day performing delinquency rate . . . . . . . . . . . . . . . . . . . . . . . . . . 4.05% 3.60% 45bps
30+ day performing delinquency rate (excluding Acquired Loans)(3) .5.50 5.34 16
30+ day delinquency rate . . . . . . . . . . . . . . . . . . . . . . . . . . . . . . . . . . . 4.67 4.23 44
30+ day delinquency rate (excluding Acquired Loans)(3) . . . . . . . . . . . 6.34 6.28 6
Nonperforming loans rate . . . . . . . . . . . . . . . . . . . . . . . . . . . . . . . . . . . 0.79 0.77 2
Nonperforming loans rate (excluding Acquired Loans)(3) . . . . . . . . . . 1.08 1.14 (6)
Nonperforming asset rate(4) . . . . . . . . . . . . . . . . . . . . . . . . . . . . . . . . . . 1.10 1.06 4
Nonperforming asset rate (excluding Acquired Loans)(3)(4) . . . . . . . . . 1.50 1.57 (7)
Allowance for loan and lease losses . . . . . . . . . . . . . . . . . . . . . . . . . . . $ 868 $ 779 11%
Allowance coverage ratio(5)(6) . . . . . . . . . . . . . . . . . . . . . . . . . . . . . . . . 1.23% 1.09% 14bps
Deposits. . . . . . . . . . . . . . . . . . . . . . . . . . . . . . . . . . . . . . . . . . . . . . . . . $ 172,702 $ 168,078 3%
Loans serviced for others . . . . . . . . . . . . . . . . . . . . . . . . . . . . . . . . . . . 7,530 6,701 12
__________
(1) The period-end consumer banking loans held for investment includes Acquired Loans with carrying values of $18.6 billion and $23.3 billion as of December 31,
2015 and 2014, respectively. The average balance of consumer banking loans held for investment includes Acquired Loans of $20.7 billion, $25.6 billion
and $31.7 billion in 2015, 2014 and 2013, respectively. See “MD&A—Glossary and Acronyms” for the definition of “Acquired Loans.”
(2) Calculated by dividing interest income for the period by average loans held for investment during the period. Interest income excludes various allocations
including funds transfer pricing that assigns certain balance sheet assets, deposits and other liabilities and their related revenue and expenses attributable to
each business segment.
(3) See “MD&A—Credit Risk Profile” and “Note 1—Summary of Significant Accounting Policies” for additional information on the impact of Acquired Loans
on our credit quality metrics.
(4) Nonperforming assets consist of nonperforming loans, real estate owned (“REO”) and other foreclosed assets. The nonperforming asset rate is calculated
based on nonperforming assets as of the end of the period divided by the sum of period-end loans held for investment, foreclosed properties and other
foreclosed assets, and is adjusted to exclude the impact of acquired REOs.
(5) Calculated by dividing the allowance for loan and lease losses as of the end of the period by period-end loans held for investment.
(6) Excluding the impact of acquired home loans, the coverage ratios for our home loan portfolio and total consumer banking were 0.50% and 1.60%, respectively,
as of December 31, 2015, compared to 0.52% and 1.56%, respectively, as of December 31, 2014.
Key factors affecting the results of our Consumer Banking business for 2015, compared to 2014, and changes in financial condition
and credit performance between December 31, 2015 and December 31, 2014 include the following:
• Net Interest Income: Net interest income remained flat at $5.8 billion in 2015, as the higher net interest income generated
by the growth in our auto loan portfolio was partially offset by lower net interest income from our home loan portfolio
attributable to the planned run-off of the acquired portfolio and margin compression in auto loans.
Consumer Banking loan yield remained flat at 6.3% in 2015, as the decrease in average loan yield in our auto loan portfolio
was offset by changes in the product mix in Consumer Banking as a result of growth in our auto loan portfolio and the
planned run-off of the acquired home loan portfolio. The increase in our auto loan portfolio in relation to our total consumer
banking loan portfolio drove an increase in the total Consumer Banking yield, even as the average yield on auto loans
decreased by 65 basis points to 8.0% in 2015. This decrease was primarily attributable to two factors: (i) a shift to a higher
proportion of prime auto loans; and (ii) continued competition across the auto business. The average yield on the home loan
portfolio increased by 6 basis points to 3.9% in 2015, as a result of higher yield on our acquired home loan portfolio.
• Non-Interest Income: Non-interest income increased by $26 million to $710 million in 2015, primarily due to the gain
recognized on loans originated and sold within our home loan portfolio.