Capital One 2015 Annual Report Download - page 80
Download and view the complete annual report
Please find page 80 of the 2015 Capital One annual report below. You can navigate through the pages in the report by either clicking on the pages listed below, or by using the keyword search tool below to find specific information within the annual report.-
 1
1 -
2
-
3
-
4
-
5
-
6
-
7
-
8
-
9
-
10
-
11
-
12
-
13
-
14
-
15
-
16
-
17
-
18
-
19
-
20
-
21
-
22
-
23
-
24
-
25
-
26
-
27
-
28
-
29
-
30
-
31
-
32
-
33
-
34
-
35
-
36
-
37
-
38
-
39
-
40
-
41
-
42
-
43
-
44
-
45
-
46
-
47
-
48
-
49
-
50
-
51
-
52
-
53
-
54
-
55
-
56
-
57
-
58
-
59
-
60
-
61
-
62
-
63
-
64
-
65
-
66
-
67
-
68
-
69
-
 70
70 -
 71
71 -
 72
72 -
 73
73 -
 74
74 -
 75
75 -
 76
76 -
 77
77 -
 78
78 -
 79
79 -
 80
80 -
 81
81 -
 82
82 -
 83
83 -
 84
84 -
 85
85 -
 86
86 -
 87
87 -
 88
88 -
 89
89 -
 90
90 -
91
-
92
-
93
-
94
-
95
-
96
-
97
-
98
-
99
-
100
-
101
-
102
-
103
-
104
-
105
-
106
-
107
-
108
-
109
-
110
-
111
-
112
-
113
-
114
-
115
-
116
-
117
-
118
-
119
-
120
-
121
-
122
-
123
-
124
-
125
-
126
-
127
-
128
-
129
-
130
-
131
-
132
-
133
-
134
-
135
-
136
-
137
-
138
-
139
-
140
-
141
-
142
-
143
-
144
-
145
-
146
-
147
-
148
-
149
-
150
-
151
-
152
-
153
-
154
-
155
-
156
-
157
-
158
-
159
-
160
-
161
-
162
-
163
-
164
-
165
-
166
-
167
-
168
-
169
-
170
-
171
-
172
-
173
-
174
-
175
-
176
-
177
-
178
-
179
-
180
-
181
-
182
-
183
-
184
-
185
-
186
-
187
-
188
-
189
-
190
-
191
-
192
-
193
-
194
-
195
-
196
-
197
-
198
-
199
-
200
-
201
-
202
-
203
-
204
-
205
-
206
-
207
-
208
-
209
-
210
-
211
-
212
-
213
-
214
-
215
-
216
-
217
-
218
-
219
-
220
-
221
-
222
-
223
-
224
-
225
-
226
-
227
-
228
-
229
-
230
-
231
-
232
-
233
-
234
-
235
-
236
-
237
-
238
-
239
-
240
-
241
-
242
-
243
-
244
-
245
-
246
-
247
-
248
-
249
-
250
-
251
-
252
-
253
 |
 |
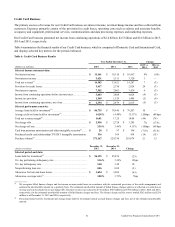
61 Capital One Financial Corporation (COF)
and multifamily real estate loan portfolios. Average loans held for investment increased by $4.9 billion to $52.8 billion in
2015 compared to 2014 primarily driven by growth in our commercial and multifamily real estate loan portfolios.
• Deposits: Period-end deposits increased by $2.3 billion to $34.3 billion as of December 31, 2015 from December 31, 2014,
driven by our strategy to strengthen existing relationships with and increase liquidity from our commercial customers.
• Net Charge-off and Nonperforming Statistics: The net charge-off rate increased by 7 basis points to 0.09% in 2015 compared
to 2014. The nonperforming loans rate increased by 53 basis points to 0.87% as of December 31, 2015 from December 31,
2014. The increases in these rates reflect losses and credit risk rating downgrades in our oil and gas portfolio and taxi
medallion lending portfolio.
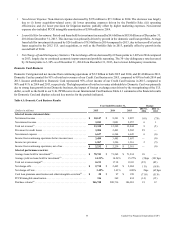
Key factors affecting the results of our Commercial Banking business for 2014, compared to 2013, and changes in financial
condition and credit performance between December 31, 2014 and December 31, 2013 include the following:
• Net Interest Income: Net interest income increased by $77 million to $1.8 billion in 2014. The increase was driven by growth
in commercial and multifamily real estate and commercial and industrial loans, partially offset by lower loan yields driven
by market and competitive pressures.
• Non-Interest Income: Non-interest income increased by $55 million to $450 million in 2014, primarily driven by increased
revenue related to fee-based services and products attributable to multifamily finance business.
• Provision for Credit Losses: The provision for credit losses increased by $117 million to $93 million in 2014, primarily due
to the change from an allowance release in 2013 driven by credit improvements, to an allowance build in 2014 attributable
to loan growth and portfolio specific risks. The above impact was partially offset by a smaller reserve build due to lower
growth in unfunded lending commitments.
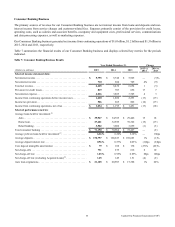
• Non-Interest Expense: Non-interest expense increased by $125 million to $1.1 billion in 2014, driven by operating expenses
associated with continued investments in business growth.
• Loans Held for Investment: Period-end loans held for investment increased by $5.9 billion to $50.9 billion as of December 31,
2014 from December 31, 2013, and average loans held for investment increased by $7.1 billion to $47.9 billion in 2014
compared to 2013. The increases were driven by loan growth in the commercial and industrial and commercial and
multifamily real estate businesses.
• Deposits: Period-end deposits increased by $1.4 billion to $32.0 billion as of December 31, 2014 from December 31, 2013,
driven by our strategy to deepen and expand relationships with commercial customers.
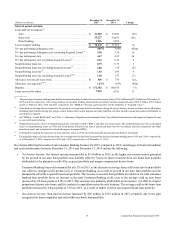
• Net Charge-off Statistics: The net charge-off rate decreased by 1 basis point to 0.02% in 2014. The nonperforming loans
rate increased by 1 basis point to 0.34% as of December 31, 2014 from December 31, 2013. The continued strength in the
credit metrics in our Commercial Banking business reflects stable credit trends.
Other Category
Other includes unallocated amounts related to our centralized Corporate Treasury group activities, such as management of our
corporate investment portfolio and asset/liability management, and certain capital management activities. Other also includes
foreign exchange-rate fluctuations on foreign currency-denominated balances; unallocated corporate expenses that do not directly
support the operations of the business segments or for which the business segments are not considered financially accountable in
evaluating their performance, such as certain acquisition and restructuring charges; a portion of the net provision (benefit) for
representation and warranty losses related to continuing operations; and offsets related to certain line-item reclassifications.