Capital One 2015 Annual Report Download - page 117
Download and view the complete annual report
Please find page 117 of the 2015 Capital One annual report below. You can navigate through the pages in the report by either clicking on the pages listed below, or by using the keyword search tool below to find specific information within the annual report.-
 1
1 -
2
-
3
-
4
-
5
-
6
-
7
-
8
-
9
-
10
-
11
-
12
-
13
-
14
-
15
-
16
-
17
-
18
-
19
-
20
-
21
-
22
-
23
-
24
-
25
-
26
-
27
-
28
-
29
-
30
-
31
-
32
-
33
-
34
-
35
-
36
-
37
-
38
-
39
-
40
-
41
-
42
-
43
-
44
-
45
-
46
-
47
-
48
-
49
-
50
-
51
-
52
-
53
-
54
-
55
-
56
-
57
-
58
-
59
-
60
-
61
-
62
-
63
-
64
-
65
-
66
-
67
-
68
-
69
-
70
-
71
-
72
-
73
-
74
-
75
-
76
-
77
-
78
-
79
-
80
-
81
-
82
-
83
-
84
-
85
-
86
-
87
-
88
-
89
-
90
-
91
-
92
-
93
-
94
-
95
-
96
-
97
-
98
-
99
-
100
-
101
-
102
-
103
-
104
-
105
-
106
-
 107
107 -
 108
108 -
 109
109 -
 110
110 -
 111
111 -
 112
112 -
 113
113 -
 114
114 -
 115
115 -
 116
116 -
 117
117 -
 118
118 -
 119
119 -
 120
120 -
 121
121 -
 122
122 -
 123
123 -
 124
124 -
 125
125 -
 126
126 -
 127
127 -
128
-
129
-
130
-
131
-
132
-
133
-
134
-
135
-
136
-
137
-
138
-
139
-
140
-
141
-
142
-
143
-
144
-
145
-
146
-
147
-
148
-
149
-
150
-
151
-
152
-
153
-
154
-
155
-
156
-
157
-
158
-
159
-
160
-
161
-
162
-
163
-
164
-
165
-
166
-
167
-
168
-
169
-
170
-
171
-
172
-
173
-
174
-
175
-
176
-
177
-
178
-
179
-
180
-
181
-
182
-
183
-
184
-
185
-
186
-
187
-
188
-
189
-
190
-
191
-
192
-
193
-
194
-
195
-
196
-
197
-
198
-
199
-
200
-
201
-
202
-
203
-
204
-
205
-
206
-
207
-
208
-
209
-
210
-
211
-
212
-
213
-
214
-
215
-
216
-
217
-
218
-
219
-
220
-
221
-
222
-
223
-
224
-
225
-
226
-
227
-
228
-
229
-
230
-
231
-
232
-
233
-
234
-
235
-
236
-
237
-
238
-
239
-
240
-
241
-
242
-
243
-
244
-
245
-
246
-
247
-
248
-
249
-
250
-
251
-
252
-
253
 |
 |

98 Capital One Financial Corporation (COF)
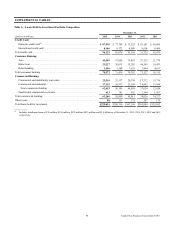
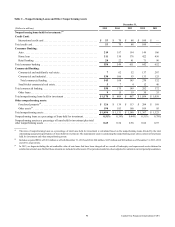
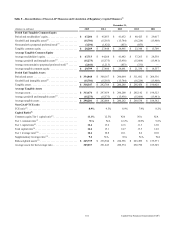
Table C—Nonperforming Loans and Other Nonperforming Assets
December 31,
(Dollars in millions) 2015 2014 2013 2012 2011
Nonperforming loans held for investment:(1)
Credit Card:
International credit card . . . . . . . . . . . . . . . . . . . . . . . . . . . . . . . . . . . . . . . . . . $ 53 $ 70 $ 88 $ 100 $ —
Total credit card. . . . . . . . . . . . . . . . . . . . . . . . . . . . . . . . . . . . . . . . . . . . . . . . . . . 53 70 88 100 —
Consumer Banking:
Auto . . . . . . . . . . . . . . . . . . . . . . . . . . . . . . . . . . . . . . . . . . . . . . . . . . . . . . . . . 219 197 194 149 106
Home loan . . . . . . . . . . . . . . . . . . . . . . . . . . . . . . . . . . . . . . . . . . . . . . . . . . . . 311 330 376 422 456
Retail banking . . . . . . . . . . . . . . . . . . . . . . . . . . . . . . . . . . . . . . . . . . . . . . . . . 28 22 41 71 90
Total consumer banking . . . . . . . . . . . . . . . . . . . . . . . . . . . . . . . . . . . . . . . . . . . . 558 549 611 642 652
Commercial Banking:
Commercial and multifamily real estate . . . . . . . . . . . . . . . . . . . . . . . . . . . . . 762 52 137 207
Commercial and industrial . . . . . . . . . . . . . . . . . . . . . . . . . . . . . . . . . . . . . . . . 538 106 93 133 125
Total commercial lending . . . . . . . . . . . . . . . . . . . . . . . . . . . . . . . . . . . . . . . 545 168 145 270 332
Small-ticket commercial real estate . . . . . . . . . . . . . . . . . . . . . . . . . . . . . . . . . 57 4 12 40
Total commercial banking. . . . . . . . . . . . . . . . . . . . . . . . . . . . . . . . . . . . . . . . . . . 550 175 149 282 372
Other loans . . . . . . . . . . . . . . . . . . . . . . . . . . . . . . . . . . . . . . . . . . . . . . . . . . . . 915 19 30 35
Total nonperforming loans held for investment . . . . . . . . . . . . . . . . . . . . . . . . . . $ 1,170 $ 809 $ 867 $ 1,054 $ 1,059
Other nonperforming assets:
Foreclosed property(2)
. . . . . . . . . . . . . . . . . . . . . . . . . . . . . . . . . . . . . . . . . . . . $ 126 $ 139 $ 113 $ 204 $ 169
Other assets(3) . . . . . . . . . . . . . . . . . . . . . . . . . . . . . . . . . . . . . . . . . . . . . . . . . . 198 183 160 109 95
Total nonperforming assets . . . . . . . . . . . . . . . . . . . . . . . . . . . . . . . . . . . . . . . . . . $ 1,494 $ 1,131 $ 1,140 $ 1,367 $ 1,323
Nonperforming loans as a percentage of loans held for investment . . . . . . . . . . . 0.51% 0.39% 0.44% 0.51% 0.78%
Nonperforming assets as a percentage of loans held for investment plus total
other nonperforming assets . . . . . . . . . . . . . . . . . . . . . . . . . . . . . . . . . . . . . . . . . . 0.65 0.54 0.58 0.66 0.97
__________
(1) The ratio of nonperforming loans as a percentage of total loans held for investment is calculated based on the nonperforming loans divided by the total
outstanding unpaid principal balance of loans held for investment. The denominator used in calculating the nonperforming asset ratios consists of total loans
held for investment and other nonperforming assets.
(2) Includes acquired REOs of $101 million as of both December 31, 2015 and 2014, $68 million, $167 million and $86 million as of December 31, 2013, 2012
and 2011, respectively.
(3) In 2013, we began including the net realizable value of auto loans that have been charged-off as a result of bankruptcy and repossessed assets obtained in
satisfaction of auto loans. Both of these amounts are included in other assets. Prior period amounts have been adjusted to conform to current period presentation.