Capital One 2015 Annual Report Download - page 222
Download and view the complete annual report
Please find page 222 of the 2015 Capital One annual report below. You can navigate through the pages in the report by either clicking on the pages listed below, or by using the keyword search tool below to find specific information within the annual report.-
 1
1 -
2
-
3
-
4
-
5
-
6
-
7
-
8
-
9
-
10
-
11
-
12
-
13
-
14
-
15
-
16
-
17
-
18
-
19
-
20
-
21
-
22
-
23
-
24
-
25
-
26
-
27
-
28
-
29
-
30
-
31
-
32
-
33
-
34
-
35
-
36
-
37
-
38
-
39
-
40
-
41
-
42
-
43
-
44
-
45
-
46
-
47
-
48
-
49
-
50
-
51
-
52
-
53
-
54
-
55
-
56
-
57
-
58
-
59
-
60
-
61
-
62
-
63
-
64
-
65
-
66
-
67
-
68
-
69
-
70
-
71
-
72
-
73
-
74
-
75
-
76
-
77
-
78
-
79
-
80
-
81
-
82
-
83
-
84
-
85
-
86
-
87
-
88
-
89
-
90
-
91
-
92
-
93
-
94
-
95
-
96
-
97
-
98
-
99
-
100
-
101
-
102
-
103
-
104
-
105
-
106
-
107
-
108
-
109
-
110
-
111
-
112
-
113
-
114
-
115
-
116
-
117
-
118
-
119
-
120
-
121
-
122
-
123
-
124
-
125
-
126
-
127
-
128
-
129
-
130
-
131
-
132
-
133
-
134
-
135
-
136
-
137
-
138
-
139
-
140
-
141
-
142
-
143
-
144
-
145
-
146
-
147
-
148
-
149
-
150
-
151
-
152
-
153
-
154
-
155
-
156
-
157
-
158
-
159
-
160
-
161
-
162
-
163
-
164
-
165
-
166
-
167
-
168
-
169
-
170
-
171
-
172
-
173
-
174
-
175
-
176
-
177
-
178
-
179
-
180
-
181
-
182
-
183
-
184
-
185
-
186
-
187
-
188
-
189
-
190
-
191
-
192
-
193
-
194
-
195
-
196
-
197
-
198
-
199
-
200
-
201
-
202
-
203
-
204
-
205
-
206
-
207
-
208
-
209
-
210
-
211
-
 212
212 -
 213
213 -
 214
214 -
 215
215 -
 216
216 -
 217
217 -
 218
218 -
 219
219 -
 220
220 -
 221
221 -
 222
222 -
 223
223 -
 224
224 -
 225
225 -
 226
226 -
 227
227 -
 228
228 -
 229
229 -
 230
230 -
 231
231 -
 232
232 -
233
-
234
-
235
-
236
-
237
-
238
-
239
-
240
-
241
-
242
-
243
-
244
-
245
-
246
-
247
-
248
-
249
-
250
-
251
-
252
-
253
 |
 |

CAPITAL ONE FINANCIAL CORPORATION
NOTES TO CONSOLIDATED FINANCIAL STATEMENTS
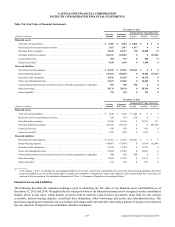
203 Capital One Financial Corporation (COF)
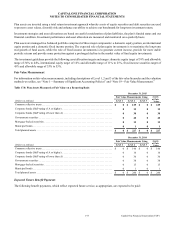
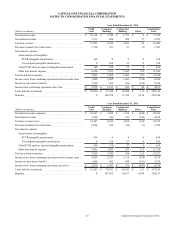
(Dollars in millions)
Fair Value at
December 31,
2014
Significant
Valuation
Techniques
Significant
Unobservable
Inputs Range
Weighted
Average
Assets:
Securities available for sale:
RMBS . . . . . . . . . . . . . . . . . . . . . . $ 561 Discounted cash flows
(3rd party pricing)
Yield
Constant prepayment rate
Default rate
Loss severity
0-18%
0-23%
0-15%
0-85%
6%
4%
5%
55%
CMBS . . . . . . . . . . . . . . . . . . . . . . 228 Discounted cash flows
(3rd party pricing)
Yield
Constant prepayment rate
1-4%
0-100%
1%
5%
Other ABS. . . . . . . . . . . . . . . . . . . 65 Discounted cash flows
(3rd party pricing)
Yield
Constant prepayment rate
Default rate
Loss severity
2-7%
0-3%
1-10%
30-88%
5%
2%
7%
71%
U.S. government guaranteed debt
and other securities . . . . . . . . . . . .
351 Discounted cash flows
(3rd party pricing)
Yield 1-4% 3%
Other assets:
Consumer MSRs . . . . . . . . . . . . . . 53 Discounted cash flows Total prepayment rate
Discount rate
Option-adjusted spread rate
Servicing cost ($ per loan)
12-27%
12%
435-1,500 bps
$93-$209
18%
12%
478 bps
$101
Derivative assets(1) . . . . . . . . . . . . 66 Discounted cash flows Swap rates 2-3% 2%
Retained interests in
securitization(2) . . . . . . . . . . . . . . .
221 Discounted cash flows Life of receivables (months)
Constant prepayment rate
Discount rate
Default rate
Loss severity
25-72
2-13%
4-9%
2-8%
19-95%
N/A
Liabilities:
Derivative liabilities(1). . . . . . . . . . $ 43 Discounted cash flows Swap rates 2-3% 2%
__________
(1) All Level 3 derivative assets and liabilities are presented on a gross basis and are not reduced by the impact of legally enforceable master netting agreements
that allow us to net positive and negative positions and the related payables and receivables for cash collateral held or placed with the same counterparty.
(2) Due to the nature of the various mortgage securitization structures in which we have retained interests, it is not meaningful to present a consolidated weighted
average for the significant unobservable inputs.
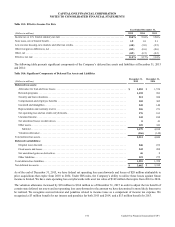
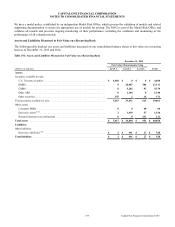
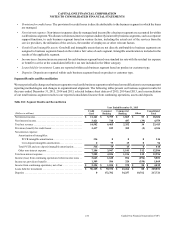
Assets and Liabilities Measured at Fair Value on a Nonrecurring Basis
We are required to measure and recognize certain other assets at fair value on a nonrecurring basis on the consolidated balance
sheets. These assets are not measured at fair value on an ongoing basis but are subject to fair value adjustments in certain
circumstances (for example, from the application of lower of cost or market accounting or when we evaluate for impairment). The
following table presents the carrying amount of the assets measured at fair value on a nonrecurring basis and still held as of
December 31, 2015 and 2014, and for which a nonrecurring fair value measurement was recorded during the years then ended:
Table 19.4: Nonrecurring Fair Value Measurements Related to Assets Still Held at Period End
December 31, 2015
Estimated Fair Value Hierarchy
Total
(Dollars in millions) Level 1 Level 2 Level 3
Loans held for investment. . . . . . . . . . . . . . . . . . . . . . . . . . . . . . . . . . . . . . . . . . . . . . . . . . . . . $ 0 $ 0 $ 362 $ 362
Loans held for sale . . . . . . . . . . . . . . . . . . . . . . . . . . . . . . . . . . . . . . . . . . . . . . . . . . . . . . . . . . 0 149 0 149
Other assets(1) . . . . . . . . . . . . . . . . . . . . . . . . . . . . . . . . . . . . . . . . . . . . . . . . . . . . . . . . . . . . . . 0 0 92 92
Total . . . . . . . . . . . . . . . . . . . . . . . . . . . . . . . . . . . . . . . . . . . . . . . . . . . . . . . . . . . . . . . . . . . . . $ 0 $ 149 $ 454 $ 603