Capital One 2015 Annual Report Download - page 83
Download and view the complete annual report
Please find page 83 of the 2015 Capital One annual report below. You can navigate through the pages in the report by either clicking on the pages listed below, or by using the keyword search tool below to find specific information within the annual report.-
 1
1 -
2
-
3
-
4
-
5
-
6
-
7
-
8
-
9
-
10
-
11
-
12
-
13
-
14
-
15
-
16
-
17
-
18
-
19
-
20
-
21
-
22
-
23
-
24
-
25
-
26
-
27
-
28
-
29
-
30
-
31
-
32
-
33
-
34
-
35
-
36
-
37
-
38
-
39
-
40
-
41
-
42
-
43
-
44
-
45
-
46
-
47
-
48
-
49
-
50
-
51
-
52
-
53
-
54
-
55
-
56
-
57
-
58
-
59
-
60
-
61
-
62
-
63
-
64
-
65
-
66
-
67
-
68
-
69
-
70
-
71
-
72
-
 73
73 -
 74
74 -
 75
75 -
 76
76 -
 77
77 -
 78
78 -
 79
79 -
 80
80 -
 81
81 -
 82
82 -
 83
83 -
 84
84 -
 85
85 -
 86
86 -
 87
87 -
 88
88 -
 89
89 -
 90
90 -
 91
91 -
 92
92 -
 93
93 -
94
-
95
-
96
-
97
-
98
-
99
-
100
-
101
-
102
-
103
-
104
-
105
-
106
-
107
-
108
-
109
-
110
-
111
-
112
-
113
-
114
-
115
-
116
-
117
-
118
-
119
-
120
-
121
-
122
-
123
-
124
-
125
-
126
-
127
-
128
-
129
-
130
-
131
-
132
-
133
-
134
-
135
-
136
-
137
-
138
-
139
-
140
-
141
-
142
-
143
-
144
-
145
-
146
-
147
-
148
-
149
-
150
-
151
-
152
-
153
-
154
-
155
-
156
-
157
-
158
-
159
-
160
-
161
-
162
-
163
-
164
-
165
-
166
-
167
-
168
-
169
-
170
-
171
-
172
-
173
-
174
-
175
-
176
-
177
-
178
-
179
-
180
-
181
-
182
-
183
-
184
-
185
-
186
-
187
-
188
-
189
-
190
-
191
-
192
-
193
-
194
-
195
-
196
-
197
-
198
-
199
-
200
-
201
-
202
-
203
-
204
-
205
-
206
-
207
-
208
-
209
-
210
-
211
-
212
-
213
-
214
-
215
-
216
-
217
-
218
-
219
-
220
-
221
-
222
-
223
-
224
-
225
-
226
-
227
-
228
-
229
-
230
-
231
-
232
-
233
-
234
-
235
-
236
-
237
-
238
-
239
-
240
-
241
-
242
-
243
-
244
-
245
-
246
-
247
-
248
-
249
-
250
-
251
-
252
-
253
 |
 |

64 Capital One Financial Corporation (COF)
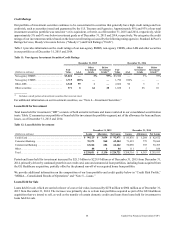
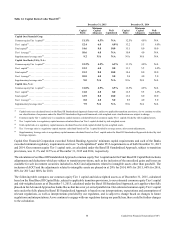
Credit Ratings
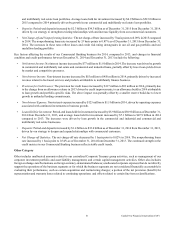
Our portfolio of investment securities continues to be concentrated in securities that generally have high credit ratings and low
credit risk, such as securities issued and guaranteed by the U.S. Treasury and Agencies. Approximately 95% and 93% of our total
investment securities portfolio was rated AA+ or its equivalent, or better, as of December 31, 2015 and 2014, respectively, while
approximately 5% and 6% was below investment grade as of December 31, 2015 and 2014, respectively. We categorize the credit
ratings of our investment securities based on the lowest credit rating as issued by the following rating agencies: Standard & Poor’s
Ratings Services, Moody’s Investors Service (“Moody’s”) and Fitch Ratings (“Fitch”).
Table 11 provides information on the credit ratings of our non-agency RMBS, non-agency CMBS, other ABS and other securities
in our portfolio as of December 31, 2015 and 2014.
Table 11: Non-Agency Investment Securities Credit Ratings
December 31, 2015 December 31, 2014
(Dollars in millions)
Fair
Value AAA
Other
Investment
Grade
Below
Investment
Grade(1) Fair
Value AAA
Other
Investment
Grade
Below
Investment
Grade(1)
Non-agency RMBS . . . . . . . . . . . . . . . . . . . . $ 3,026 — 3% 97% $ 3,386 — 3% 97%
Non-agency CMBS . . . . . . . . . . . . . . . . . . . . 1,715 100% — — 1,796 100% — —
Other ABS . . . . . . . . . . . . . . . . . . . . . . . . . . . 1,340 99 1 — 2,662 90 5 5
Other securities. . . . . . . . . . . . . . . . . . . . . . . . 371 8 64 28 1,028 2 88 10
__________
(1) Includes a small portion of investment securities that were not rated.
For additional information on our investment securities, see “Note 4—Investment Securities.”
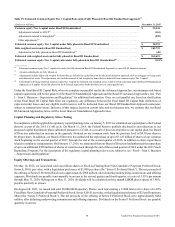
Loans Held for Investment
Total loans held for investment (“HFI”) consists of both unrestricted loans and loans restricted in our consolidated securitization
trusts. Table 12 summarizes our portfolio of loans held for investment by portfolio segment, net of the allowance for loan and lease
losses, as of December 31, 2015 and 2014.
Table 12: Loans Held for Investment
December 31, 2015 December 31, 2014
(Dollars in millions) Loans Allowance Net Loans Loans Allowance Net Loans
Credit Card . . . . . . . . . . . . . . . . . . . . . . . . . . . . . . . . . . . . . . . . . . $ 96,125 $ 3,654 $ 92,471 $ 85,876 $ 3,204 $ 82,672
Consumer Banking . . . . . . . . . . . . . . . . . . . . . . . . . . . . . . . . . . . . 70,372 868 69,504 71,439 779 70,660
Commercial Banking . . . . . . . . . . . . . . . . . . . . . . . . . . . . . . . . . . 63,266 604 62,662 50,890 395 50,495
Other . . . . . . . . . . . . . . . . . . . . . . . . . . . . . . . . . . . . . . . . . . . . . . . 88 4 84 111 5 106
Total . . . . . . . . . . . . . . . . . . . . . . . . . . . . . . . . . . . . . . . . . . . . . . . $ 229,851 $ 5,130 $ 224,721 $ 208,316 $ 4,383 $ 203,933
Period-end loans held for investment increased by $21.5 billion to $229.9 billion as of December 31, 2015 from December 31,
2014, primarily driven by continued growth in our credit card, auto and commercial loan portfolios, including loans acquired from
the GE Healthcare acquisition, partially offset by the planned run-off of our acquired home loan portfolio.
We provide additional information on the composition of our loan portfolio and credit quality below in “Credit Risk Profile,”
“MD&A—Consolidated Results of Operations” and “Note 5—Loans.”
Loans Held for Sale
Loans held for sale, which are carried at lower of cost or fair value, increased by $278 million to $904 million as of December 31,
2015 from December 31, 2014. The increase was primarily due to certain loan portfolios acquired as part of the GE Healthcare
acquisition that we intend to sell, as well as the transfer of certain domestic credit card loans from loans held for investment to
loans held for sale.