Capital One 2015 Annual Report Download - page 85
Download and view the complete annual report
Please find page 85 of the 2015 Capital One annual report below. You can navigate through the pages in the report by either clicking on the pages listed below, or by using the keyword search tool below to find specific information within the annual report.-
 1
1 -
2
-
3
-
4
-
5
-
6
-
7
-
8
-
9
-
10
-
11
-
12
-
13
-
14
-
15
-
16
-
17
-
18
-
19
-
20
-
21
-
22
-
23
-
24
-
25
-
26
-
27
-
28
-
29
-
30
-
31
-
32
-
33
-
34
-
35
-
36
-
37
-
38
-
39
-
40
-
41
-
42
-
43
-
44
-
45
-
46
-
47
-
48
-
49
-
50
-
51
-
52
-
53
-
54
-
55
-
56
-
57
-
58
-
59
-
60
-
61
-
62
-
63
-
64
-
65
-
66
-
67
-
68
-
69
-
70
-
71
-
72
-
73
-
74
-
 75
75 -
 76
76 -
 77
77 -
 78
78 -
 79
79 -
 80
80 -
 81
81 -
 82
82 -
 83
83 -
 84
84 -
 85
85 -
 86
86 -
 87
87 -
 88
88 -
 89
89 -
 90
90 -
 91
91 -
 92
92 -
 93
93 -
 94
94 -
 95
95 -
96
-
97
-
98
-
99
-
100
-
101
-
102
-
103
-
104
-
105
-
106
-
107
-
108
-
109
-
110
-
111
-
112
-
113
-
114
-
115
-
116
-
117
-
118
-
119
-
120
-
121
-
122
-
123
-
124
-
125
-
126
-
127
-
128
-
129
-
130
-
131
-
132
-
133
-
134
-
135
-
136
-
137
-
138
-
139
-
140
-
141
-
142
-
143
-
144
-
145
-
146
-
147
-
148
-
149
-
150
-
151
-
152
-
153
-
154
-
155
-
156
-
157
-
158
-
159
-
160
-
161
-
162
-
163
-
164
-
165
-
166
-
167
-
168
-
169
-
170
-
171
-
172
-
173
-
174
-
175
-
176
-
177
-
178
-
179
-
180
-
181
-
182
-
183
-
184
-
185
-
186
-
187
-
188
-
189
-
190
-
191
-
192
-
193
-
194
-
195
-
196
-
197
-
198
-
199
-
200
-
201
-
202
-
203
-
204
-
205
-
206
-
207
-
208
-
209
-
210
-
211
-
212
-
213
-
214
-
215
-
216
-
217
-
218
-
219
-
220
-
221
-
222
-
223
-
224
-
225
-
226
-
227
-
228
-
229
-
230
-
231
-
232
-
233
-
234
-
235
-
236
-
237
-
238
-
239
-
240
-
241
-
242
-
243
-
244
-
245
-
246
-
247
-
248
-
249
-
250
-
251
-
252
-
253
 |
 |

66 Capital One Financial Corporation (COF)
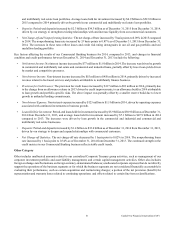
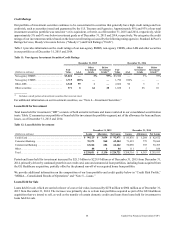
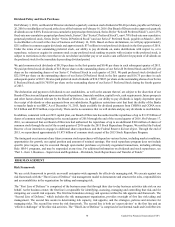
The table below summarizes changes in our representation and warranty reserve in 2015 and 2014.
Table 13: Changes in Representation and Warranty Reserve
Year Ended December 31,
(Dollars in millions) 2015 2014
Representation and warranty reserve, beginning of period . . . . . . . . . . . . . . . . . . . . . . . . . . . . . . . . . . . . . . . . . . . . $ 731 $ 1,172
Benefit for mortgage representation and warranty losses:
Recorded in continuing operations. . . . . . . . . . . . . . . . . . . . . . . . . . . . . . . . . . . . . . . . . . . . . . . . . . . . . . . . . . . . (16) (26)
Recorded in discontinued operations . . . . . . . . . . . . . . . . . . . . . . . . . . . . . . . . . . . . . . . . . . . . . . . . . . . . . . . . . . (64) (7)
Total benefit for mortgage representation and warranty losses . . . . . . . . . . . . . . . . . . . . . . . . . . . . . . . . . . . . . . . . . (80) (33)
Net realized losses . . . . . . . . . . . . . . . . . . . . . . . . . . . . . . . . . . . . . . . . . . . . . . . . . . . . . . . . . . . . . . . . . . . . . . . . . . . (41) (408)
Representation and warranty reserve, end of period . . . . . . . . . . . . . . . . . . . . . . . . . . . . . . . . . . . . . . . . . . . . . . . . . $ 610 $ 731
As part of our business planning processes, we have considered various outcomes relating to the future representation and warranty
liabilities of our subsidiaries that are possible but do not rise to the level of being both probable and reasonably estimable outcomes
justifying an incremental reserve under applicable accounting standards. Our current best estimate of reasonably possible future
losses from representation and warranty claims beyond what was in our reserve as of December 31, 2015, is approximately $1.6
billion, a decline from our estimate of $2.1 billion as of December 31, 2014. The decrease in the reasonably possible estimate for
representation and warranty claims was primarily driven by favorable industry legal developments.
We provide additional information related to the representation and warranty reserve, including factors that may impact the adequacy
of the reserve and the ultimate amount of losses incurred by our subsidiaries, in “Note 21—Commitments, Contingencies,
Guarantees and Others.”
Deferred Tax Assets and Liabilities
Deferred tax assets and liabilities represent decreases or increases in taxes expected to be paid in the future because of future
reversals of temporary differences between the financial reporting and tax bases of assets and liabilities, as well as from net
operating loss and tax credit carryforwards. Deferred tax assets are recognized subject to management’s judgment that realization
is more likely than not. We evaluate the recoverability of these future tax deductions by assessing the adequacy of expected taxable
income from all sources, including taxable income in carryback years, reversal of taxable temporary differences, forecasted
operating earnings and available tax planning strategies. These sources of income rely heavily on estimates. We use our historical
experience and our short and long-range business forecasts to provide insight.
As of December 31, 2015, we have recorded deferred tax assets, net of deferred tax liabilities and valuation allowances, of
approximately $3.7 billion, which is an increase of $330 million from December 31, 2014. We have recorded a valuation allowance
of $166 million and $148 million as of December 31, 2015 and 2014, respectively. We expect to fully realize the 2015 net deferred
tax asset amounts in future periods. If changes in circumstances lead us to change our judgment about our ability to realize deferred
tax assets in future years, we will adjust our valuation allowances in the period that our change in judgment occurs and record a
corresponding increase or charge to income.
We provide additional information on income taxes in “Consolidated Results of Operations” and in “Note 18—Income Taxes.”
OFF-BALANCE SHEET ARRANGEMENTS AND VARIABLE INTEREST ENTITIES
In the ordinary course of business, we are involved in various types of arrangements with limited liability companies, partnerships
or trusts that often involve special purpose entities and variable interest entities (“VIEs”). Some of these arrangements are not
recorded on our consolidated balance sheets or may be recorded in amounts different from the full contract or notional amount of
the arrangements, depending on the nature or structure of, and the accounting standards required to be applied to, the arrangement.
These arrangements may expose us to potential losses in excess of the amounts recorded on our consolidated balance sheets. Our
involvement in these arrangements can take many forms, including securitization and servicing activities, the purchase or sale of
mortgage-backed or other asset-backed securities in connection with our home loan portfolio and loans to VIEs that hold debt,
equity, real estate or other assets.