Capital One 2015 Annual Report Download - page 121
Download and view the complete annual report
Please find page 121 of the 2015 Capital One annual report below. You can navigate through the pages in the report by either clicking on the pages listed below, or by using the keyword search tool below to find specific information within the annual report.-
 1
1 -
2
-
3
-
4
-
5
-
6
-
7
-
8
-
9
-
10
-
11
-
12
-
13
-
14
-
15
-
16
-
17
-
18
-
19
-
20
-
21
-
22
-
23
-
24
-
25
-
26
-
27
-
28
-
29
-
30
-
31
-
32
-
33
-
34
-
35
-
36
-
37
-
38
-
39
-
40
-
41
-
42
-
43
-
44
-
45
-
46
-
47
-
48
-
49
-
50
-
51
-
52
-
53
-
54
-
55
-
56
-
57
-
58
-
59
-
60
-
61
-
62
-
63
-
64
-
65
-
66
-
67
-
68
-
69
-
70
-
71
-
72
-
73
-
74
-
75
-
76
-
77
-
78
-
79
-
80
-
81
-
82
-
83
-
84
-
85
-
86
-
87
-
88
-
89
-
90
-
91
-
92
-
93
-
94
-
95
-
96
-
97
-
98
-
99
-
100
-
101
-
102
-
103
-
104
-
105
-
106
-
107
-
108
-
109
-
110
-
 111
111 -
 112
112 -
 113
113 -
 114
114 -
 115
115 -
 116
116 -
 117
117 -
 118
118 -
 119
119 -
 120
120 -
 121
121 -
 122
122 -
 123
123 -
 124
124 -
 125
125 -
 126
126 -
 127
127 -
 128
128 -
 129
129 -
 130
130 -
 131
131 -
132
-
133
-
134
-
135
-
136
-
137
-
138
-
139
-
140
-
141
-
142
-
143
-
144
-
145
-
146
-
147
-
148
-
149
-
150
-
151
-
152
-
153
-
154
-
155
-
156
-
157
-
158
-
159
-
160
-
161
-
162
-
163
-
164
-
165
-
166
-
167
-
168
-
169
-
170
-
171
-
172
-
173
-
174
-
175
-
176
-
177
-
178
-
179
-
180
-
181
-
182
-
183
-
184
-
185
-
186
-
187
-
188
-
189
-
190
-
191
-
192
-
193
-
194
-
195
-
196
-
197
-
198
-
199
-
200
-
201
-
202
-
203
-
204
-
205
-
206
-
207
-
208
-
209
-
210
-
211
-
212
-
213
-
214
-
215
-
216
-
217
-
218
-
219
-
220
-
221
-
222
-
223
-
224
-
225
-
226
-
227
-
228
-
229
-
230
-
231
-
232
-
233
-
234
-
235
-
236
-
237
-
238
-
239
-
240
-
241
-
242
-
243
-
244
-
245
-
246
-
247
-
248
-
249
-
250
-
251
-
252
-
253
 |
 |

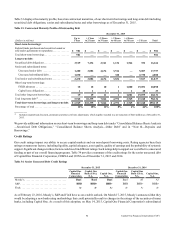
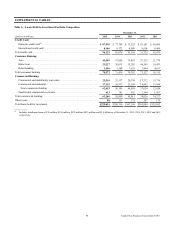
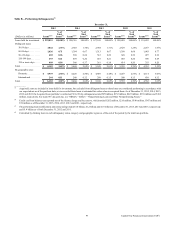
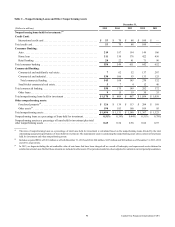
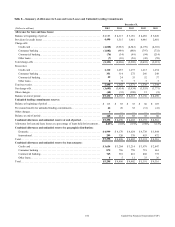
102 Capital One Financial Corporation (COF)
December 31,
(Dollars in millions) 2015 2014
Regulatory Capital Under Basel III Standardized Approach(5)
Common equity excluding AOCI . . . . . . . . . . . . . . . . . . . . . . . . . . . . . . . . . . . . . . . . . . . . . . . . . . . . . . . . . . . . $ 44,606 $ 43,661
Adjustments:
AOCI(13)(14) . . . . . . . . . . . . . . . . . . . . . . . . . . . . . . . . . . . . . . . . . . . . . . . . . . . . . . . . . . . . . . . . . . . . . . . . . . . (254) (69)
Goodwill(2) . . . . . . . . . . . . . . . . . . . . . . . . . . . . . . . . . . . . . . . . . . . . . . . . . . . . . . . . . . . . . . . . . . . . . . . . . . . (14,296) (13,805)
Intangible Assets(2)(14) . . . . . . . . . . . . . . . . . . . . . . . . . . . . . . . . . . . . . . . . . . . . . . . . . . . . . . . . . . . . . . . . . . . (393) (243)
Other. . . . . . . . . . . . . . . . . . . . . . . . . . . . . . . . . . . . . . . . . . . . . . . . . . . . . . . . . . . . . . . . . . . . . . . . . . . . . . . . (119) (10)
Common equity Tier 1 capital . . . . . . . . . . . . . . . . . . . . . . . . . . . . . . . . . . . . . . . . . . . . . . . . . . . . . . . . . . . . . . . 29,544 29,534
Tier 1 capital instruments(3) . . . . . . . . . . . . . . . . . . . . . . . . . . . . . . . . . . . . . . . . . . . . . . . . . . . . . . . . . . . . . . . . . 3,294 1,822
Additional Tier 1 capital adjustments . . . . . . . . . . . . . . . . . . . . . . . . . . . . . . . . . . . . . . . . . . . . . . . . . . . . . . . . . —(1)
Tier 1 capital . . . . . . . . . . . . . . . . . . . . . . . . . . . . . . . . . . . . . . . . . . . . . . . . . . . . . . . . . . . . . . . . . . . . . . . . . . . . 32,838 31,355
Tier 2 capital instruments . . . . . . . . . . . . . . . . . . . . . . . . . . . . . . . . . . . . . . . . . . . . . . . . . . . . . . . . . . . . . . . . . . 2,654 1,542
Qualifying allowance for loan and lease losses. . . . . . . . . . . . . . . . . . . . . . . . . . . . . . . . . . . . . . . . . . . . . . . . . . 3,346 2,981
Additional Tier 2 capital adjustments . . . . . . . . . . . . . . . . . . . . . . . . . . . . . . . . . . . . . . . . . . . . . . . . . . . . . . . . . —1
Tier 2 capital . . . . . . . . . . . . . . . . . . . . . . . . . . . . . . . . . . . . . . . . . . . . . . . . . . . . . . . . . . . . . . . . . . . . . . . . . . . . 6,000 4,524
Total capital(15) . . . . . . . . . . . . . . . . . . . . . . . . . . . . . . . . . . . . . . . . . . . . . . . . . . . . . . . . . . . . . . . . . . . . . . . . . . . $ 38,838 $ 35,879
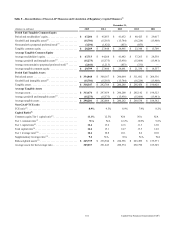
December 31,
(Dollars in millions) 2013 2012 2011
Regulatory Capital Under Basel I(5)
Total stockholders’ equity . . . . . . . . . . . . . . . . . . . . . . . . . . . . . . . . . . . . . . . . . . . . . . . . . . . . . . . . . $ 41,632 $ 40,425 $ 29,617
Adjustments:
Net unrealized losses (gains) on investment securities available for sale recorded in AOCI(13) . 791 (712) (289)
Net losses on cash flow hedges recorded in AOCI(13) . . . . . . . . . . . . . . . . . . . . . . . . . . . . . . . . . 136 2 71
Disallowed goodwill and intangible assets(2) . . . . . . . . . . . . . . . . . . . . . . . . . . . . . . . . . . . . . . . . (14,326) (14,428) (13,855)
Disallowed deferred tax assets . . . . . . . . . . . . . . . . . . . . . . . . . . . . . . . . . . . . . . . . . . . . . . . . . . . — — (563)
Noncumulative perpetual preferred stock(3) . . . . . . . . . . . . . . . . . . . . . . . . . . . . . . . . . . . . . . . . . (853) (853) —
Other . . . . . . . . . . . . . . . . . . . . . . . . . . . . . . . . . . . . . . . . . . . . . . . . . . . . . . . . . . . . . . . . . . . . . . . (5) (12) (2)
Tier 1 common capital . . . . . . . . . . . . . . . . . . . . . . . . . . . . . . . . . . . . . . . . . . . . . . . . . . . . . . . . . . . . 27,375 24,422 14,979
Noncumulative perpetual preferred stock(3) . . . . . . . . . . . . . . . . . . . . . . . . . . . . . . . . . . . . . . . . . . . . 853 853 —
Tier 1 restricted core capital items. . . . . . . . . . . . . . . . . . . . . . . . . . . . . . . . . . . . . . . . . . . . . . . . . . . 2 2 3,635
Tier 1 capital . . . . . . . . . . . . . . . . . . . . . . . . . . . . . . . . . . . . . . . . . . . . . . . . . . . . . . . . . . . . . . . . . . . 28,230 25,277 18,614
Long-term debt qualifying as Tier 2 capital. . . . . . . . . . . . . . . . . . . . . . . . . . . . . . . . . . . . . . . . . . . . 1,914 2,119 2,438
Qualifying allowance for loan and lease losses . . . . . . . . . . . . . . . . . . . . . . . . . . . . . . . . . . . . . . . . . 2,833 2,831 1,978
Other Tier 2 components . . . . . . . . . . . . . . . . . . . . . . . . . . . . . . . . . . . . . . . . . . . . . . . . . . . . . . . . . . 10 13 23
Tier 2 capital . . . . . . . . . . . . . . . . . . . . . . . . . . . . . . . . . . . . . . . . . . . . . . . . . . . . . . . . . . . . . . . . . . . 4,757 4,963 4,439
Total capital(15) . . . . . . . . . . . . . . . . . . . . . . . . . . . . . . . . . . . . . . . . . . . . . . . . . . . . . . . . . . . . . . . . . . $ 32,987 $ 30,240 $ 23,053
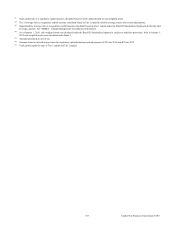
_________
(1) As of January 1, 2015, we changed our accounting principle to move from a gross basis of presentation to a net basis, for presenting qualifying derivative
assets and liabilities, as well as the related right to reclaim cash collateral or obligation to return cash collateral. See “Note 1—Summary of Significant
Accounting Policies” for additional information. Prior period results, excluding regulatory ratios, have been recast to conform to this presentation.
(2) Includes impact of related deferred taxes.
(3) Includes related surplus.
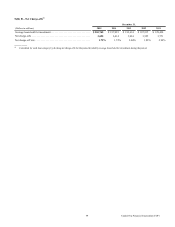
(4) Tangible common equity ratio is a non-GAAP measure calculated based on TCE divided by tangible assets.
(5) Beginning on January 1, 2014, we calculate our regulatory capital under the Basel III Standardized Approach subject to transition provisions. Prior to January
1, 2014, we calculated regulatory capital under Basel I.
(6) Common equity Tier 1 capital ratio is a regulatory capital measure calculated based on common equity Tier 1 capital divided by risk-weighted assets.
(7) Tier 1 common capital ratio is a regulatory capital measure under Basel I calculated based on Tier 1 common capital divided by Basel I risk-weighted assets.
(8) Tier 1 capital ratio is a regulatory capital measure calculated based on Tier 1 capital divided by risk-weighted assets.