Capital One 2015 Annual Report Download - page 64
Download and view the complete annual report
Please find page 64 of the 2015 Capital One annual report below. You can navigate through the pages in the report by either clicking on the pages listed below, or by using the keyword search tool below to find specific information within the annual report.-
 1
1 -
2
-
3
-
4
-
5
-
6
-
7
-
8
-
9
-
10
-
11
-
12
-
13
-
14
-
15
-
16
-
17
-
18
-
19
-
20
-
21
-
22
-
23
-
24
-
25
-
26
-
27
-
28
-
29
-
30
-
31
-
32
-
33
-
34
-
35
-
36
-
37
-
38
-
39
-
40
-
41
-
42
-
43
-
44
-
45
-
46
-
47
-
48
-
49
-
50
-
51
-
52
-
53
-
 54
54 -
 55
55 -
 56
56 -
 57
57 -
 58
58 -
 59
59 -
 60
60 -
 61
61 -
 62
62 -
 63
63 -
 64
64 -
 65
65 -
 66
66 -
 67
67 -
 68
68 -
 69
69 -
 70
70 -
 71
71 -
 72
72 -
 73
73 -
 74
74 -
75
-
76
-
77
-
78
-
79
-
80
-
81
-
82
-
83
-
84
-
85
-
86
-
87
-
88
-
89
-
90
-
91
-
92
-
93
-
94
-
95
-
96
-
97
-
98
-
99
-
100
-
101
-
102
-
103
-
104
-
105
-
106
-
107
-
108
-
109
-
110
-
111
-
112
-
113
-
114
-
115
-
116
-
117
-
118
-
119
-
120
-
121
-
122
-
123
-
124
-
125
-
126
-
127
-
128
-
129
-
130
-
131
-
132
-
133
-
134
-
135
-
136
-
137
-
138
-
139
-
140
-
141
-
142
-
143
-
144
-
145
-
146
-
147
-
148
-
149
-
150
-
151
-
152
-
153
-
154
-
155
-
156
-
157
-
158
-
159
-
160
-
161
-
162
-
163
-
164
-
165
-
166
-
167
-
168
-
169
-
170
-
171
-
172
-
173
-
174
-
175
-
176
-
177
-
178
-
179
-
180
-
181
-
182
-
183
-
184
-
185
-
186
-
187
-
188
-
189
-
190
-
191
-
192
-
193
-
194
-
195
-
196
-
197
-
198
-
199
-
200
-
201
-
202
-
203
-
204
-
205
-
206
-
207
-
208
-
209
-
210
-
211
-
212
-
213
-
214
-
215
-
216
-
217
-
218
-
219
-
220
-
221
-
222
-
223
-
224
-
225
-
226
-
227
-
228
-
229
-
230
-
231
-
232
-
233
-
234
-
235
-
236
-
237
-
238
-
239
-
240
-
241
-
242
-
243
-
244
-
245
-
246
-
247
-
248
-
249
-
250
-
251
-
252
-
253
 |
 |

45 Capital One Financial Corporation (COF)
Customer Rewards Reserve
We offer products, primarily credit cards, which include programs that allow members to earn rewards, in the form of points, that
can be redeemed for cash (primarily in the form of statement credits), gift cards, airline tickets or merchandise, based on account
activity. The amount of rewards that a customer earns varies based on the terms and conditions of the rewards program and product.
The majority of our rewards do not expire and there is no limit on the number of rewards points an eligible card member can earn.
Customer rewards costs, which we generally record as an offset to interchange income, are driven by various factors, such as card
member purchase volume, the terms and conditions of the rewards program and rewards redemption cost. We establish a customer
rewards reserve that reflects management’s judgment regarding rewards earned that are expected to be redeemed and the estimated
redemption cost.
We use financial models to estimate ultimate redemption rates of rewards earned to date by current card members based on historical
redemption trends, current enrollee redemption behavior, card product type, year of program enrollment, enrollment tenure and
card spend levels. Our current assumption is that the vast majority of all rewards earned will eventually be redeemed. We use a
weighted-average cost per reward redeemed during the previous twelve months, adjusted as appropriate for recent changes in
redemption costs, including mix of rewards redeemed, to estimate future redemption costs. We continually evaluate our reserve
and assumptions based on developments in redemption patterns, cost per point redeemed, changes to the terms and conditions of
the rewards program and other factors. Changes in the ultimate redemption rate and weighted-average cost per point have the
effect of either increasing or decreasing the reserve through the current period provision by an amount estimated to cover the cost
of all points previously earned but not yet redeemed by card members as of the end of the reporting period. We recognized customer
rewards expense of $2.7 billion, $2.0 billion and $1.6 billion in 2015, 2014 and 2013, respectively. Our customer rewards liability,
which is included in other liabilities on our consolidated balance sheets, totaled $3.2 billion and $2.7 billion as of December 31,
2015 and 2014, respectively.
ACCOUNTING CHANGES AND DEVELOPMENTS
Accounting for Derivative Assets and Liabilities
As of January 1, 2015, we changed our accounting principle to move from a gross basis of presentation to a net basis, for presenting
qualifying derivative assets and liabilities, as well as the related fair value amounts recognized for the right to reclaim cash collateral
(a receivable) or the obligation to return cash collateral (a payable), for instruments executed with the same counterparty where a
right of setoff exists. This newly adopted policy is preferable as it more accurately reflects the Company’s counterparty credit risk
as well as our contractual rights and obligations under these arrangements. Further, this change will align our presentation with
that of the majority of our peer institutions. We retrospectively adopted this change in accounting principle and our consolidated
balance sheet has been recast for all prior periods presented.
See “Note 1—Summary of Significant Accounting Policies” in the Notes to Consolidated Financial Statements in Item 8 of this
Report regarding the impact of recently issued or adopted new accounting pronouncements.
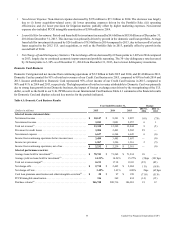
CONSOLIDATED RESULTS OF OPERATIONS
The section below provides a comparative discussion of our consolidated financial performance for 2015, 2014 and 2013. Following
this section, we provide a discussion of our business segment results. You should read this section together with our “Executive
Summary and Business Outlook,” where we discuss trends and other factors that we expect will affect our future results of operations.
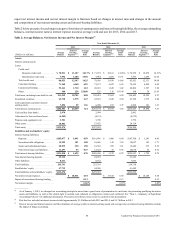
Net Interest Income
Net interest income represents the difference between the interest income, including certain fees, earned on our interest-earning
assets and the interest expense on our interest-bearing liabilities. Interest-earning assets include loans, investment securities and
other interest-earning assets and interest-bearing liabilities include interest-bearing deposits, securitized debt obligations, senior
and subordinated notes, and other borrowings. Generally, we include in interest income any past due fees on loans that we deem
collectible. Our net interest margin, based on our consolidated results, represents the difference between the yield on our interest-
earning assets and the cost of our interest-bearing liabilities, including the notional impact of non-interest bearing funding. We