Capital One 2015 Annual Report Download - page 136
Download and view the complete annual report
Please find page 136 of the 2015 Capital One annual report below. You can navigate through the pages in the report by either clicking on the pages listed below, or by using the keyword search tool below to find specific information within the annual report.-
 1
1 -
2
-
3
-
4
-
5
-
6
-
7
-
8
-
9
-
10
-
11
-
12
-
13
-
14
-
15
-
16
-
17
-
18
-
19
-
20
-
21
-
22
-
23
-
24
-
25
-
26
-
27
-
28
-
29
-
30
-
31
-
32
-
33
-
34
-
35
-
36
-
37
-
38
-
39
-
40
-
41
-
42
-
43
-
44
-
45
-
46
-
47
-
48
-
49
-
50
-
51
-
52
-
53
-
54
-
55
-
56
-
57
-
58
-
59
-
60
-
61
-
62
-
63
-
64
-
65
-
66
-
67
-
68
-
69
-
70
-
71
-
72
-
73
-
74
-
75
-
76
-
77
-
78
-
79
-
80
-
81
-
82
-
83
-
84
-
85
-
86
-
87
-
88
-
89
-
90
-
91
-
92
-
93
-
94
-
95
-
96
-
97
-
98
-
99
-
100
-
101
-
102
-
103
-
104
-
105
-
106
-
107
-
108
-
109
-
110
-
111
-
112
-
113
-
114
-
115
-
116
-
117
-
118
-
119
-
120
-
121
-
122
-
123
-
124
-
125
-
 126
126 -
 127
127 -
 128
128 -
 129
129 -
 130
130 -
 131
131 -
 132
132 -
 133
133 -
 134
134 -
 135
135 -
 136
136 -
 137
137 -
 138
138 -
 139
139 -
 140
140 -
 141
141 -
 142
142 -
 143
143 -
 144
144 -
 145
145 -
 146
146 -
147
-
148
-
149
-
150
-
151
-
152
-
153
-
154
-
155
-
156
-
157
-
158
-
159
-
160
-
161
-
162
-
163
-
164
-
165
-
166
-
167
-
168
-
169
-
170
-
171
-
172
-
173
-
174
-
175
-
176
-
177
-
178
-
179
-
180
-
181
-
182
-
183
-
184
-
185
-
186
-
187
-
188
-
189
-
190
-
191
-
192
-
193
-
194
-
195
-
196
-
197
-
198
-
199
-
200
-
201
-
202
-
203
-
204
-
205
-
206
-
207
-
208
-
209
-
210
-
211
-
212
-
213
-
214
-
215
-
216
-
217
-
218
-
219
-
220
-
221
-
222
-
223
-
224
-
225
-
226
-
227
-
228
-
229
-
230
-
231
-
232
-
233
-
234
-
235
-
236
-
237
-
238
-
239
-
240
-
241
-
242
-
243
-
244
-
245
-
246
-
247
-
248
-
249
-
250
-
251
-
252
-
253
 |
 |

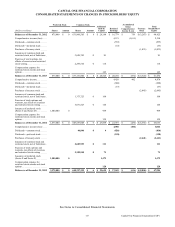
CAPITAL ONE FINANCIAL CORPORATION
CONSOLIDATED STATEMENTS OF CHANGES IN STOCKHOLDERS’ EQUITY
117 Capital One Financial Corporation (COF)
(Dollars in millions)
Preferred Stock Common Stock Additional
Paid-In
Capital
Retained
Earnings
Accumulated
Other
Comprehensive
Income (Loss)
Treasury
Stock
Total
Stockholders’
EquityShares Amount Shares Amount
Balance as of December 31, 2012 875,000 $ 0 631,806,585 $ 6 $ 26,188 $ 16,779 $ 739 $ (3,287) $ 40,425
Comprehensive income (loss) . . . . 4,121 (1,611) 2,510
Dividends—common stock . . . . . . (555) (555)
Dividends—preferred stock. . . . . . (53) (53)
Purchases of treasury stock . . . . . . (1,033) (1,033)
Issuances of common stock and
restricted stock, net of forfeitures .3,049,705 0 81 81
Exercise of stock options, tax
effects of exercises and restricted
stock vesting. . . . . . . . . . . . . . . . . . 2,295,510 0 114 114
Compensation expense for
restricted stock awards and stock
options . . . . . . . . . . . . . . . . . . . . . . 143 143
Balance as of December 31, 2013 875,000 $ 0 637,151,800 $ 6 $ 26,526 $ 20,292 $ (872) $ (4,320) $ 41,632
Comprehensive income . . . . . . . . . 4,428 442 4,870
Dividends—common stock . . . . . . (680) (680)
Dividends—preferred stock. . . . . . (67) (67)
Purchases of treasury stock . . . . . . (2,045) (2,045)
Issuances of common stock and
restricted stock, net of forfeitures .1,373,725 0 100 100
Exercise of stock options and
warrants, tax effects of exercises
and restricted stock vesting . . . . . . 5,031,523 0 146 146
Issuances of preferred stock
(Series C and Series D) . . . . . . . . . 1,000,000 0 969 969
Compensation expense for
restricted stock awards and stock
options . . . . . . . . . . . . . . . . . . . . . . 128 128
Balance as of December 31, 2014 1,875,000 $ 0 643,557,048 $ 6 $ 27,869 $ 23,973 $ (430) $ (6,365) $ 45,053
Comprehensive income (loss) . . . . 4,050 (186) 3,864
Dividends—common stock . . . . . . 46,846 0 4 (820) (816)
Dividends—preferred stock. . . . . . (158) (158)
Purchases of treasury stock . . . . . . (2,441) (2,441)
Issuances of common stock and
restricted stock, net of forfeitures .2,603,953 0 111 111
Exercise of stock options and
warrants, tax effects of exercises
and restricted stock vesting . . . . . . 2,109,548 0 71 71
Issuances of preferred stock
(Series E and Series F). . . . . . . . . . 1,500,000 0 1,472 1,472
Compensation expense for
restricted stock awards and stock
options . . . . . . . . . . . . . . . . . . . . . . 128 128
Balance as of December 31, 2015 3,375,000 $ 0 648,317,395 $ 6 $ 29,655 $ 27,045 $ (616) $ (8,806) $ 47,284
See Notes to Consolidated Financial Statements.