Capital One 2015 Annual Report Download - page 212
Download and view the complete annual report
Please find page 212 of the 2015 Capital One annual report below. You can navigate through the pages in the report by either clicking on the pages listed below, or by using the keyword search tool below to find specific information within the annual report.-
 1
1 -
2
-
3
-
4
-
5
-
6
-
7
-
8
-
9
-
10
-
11
-
12
-
13
-
14
-
15
-
16
-
17
-
18
-
19
-
20
-
21
-
22
-
23
-
24
-
25
-
26
-
27
-
28
-
29
-
30
-
31
-
32
-
33
-
34
-
35
-
36
-
37
-
38
-
39
-
40
-
41
-
42
-
43
-
44
-
45
-
46
-
47
-
48
-
49
-
50
-
51
-
52
-
53
-
54
-
55
-
56
-
57
-
58
-
59
-
60
-
61
-
62
-
63
-
64
-
65
-
66
-
67
-
68
-
69
-
70
-
71
-
72
-
73
-
74
-
75
-
76
-
77
-
78
-
79
-
80
-
81
-
82
-
83
-
84
-
85
-
86
-
87
-
88
-
89
-
90
-
91
-
92
-
93
-
94
-
95
-
96
-
97
-
98
-
99
-
100
-
101
-
102
-
103
-
104
-
105
-
106
-
107
-
108
-
109
-
110
-
111
-
112
-
113
-
114
-
115
-
116
-
117
-
118
-
119
-
120
-
121
-
122
-
123
-
124
-
125
-
126
-
127
-
128
-
129
-
130
-
131
-
132
-
133
-
134
-
135
-
136
-
137
-
138
-
139
-
140
-
141
-
142
-
143
-
144
-
145
-
146
-
147
-
148
-
149
-
150
-
151
-
152
-
153
-
154
-
155
-
156
-
157
-
158
-
159
-
160
-
161
-
162
-
163
-
164
-
165
-
166
-
167
-
168
-
169
-
170
-
171
-
172
-
173
-
174
-
175
-
176
-
177
-
178
-
179
-
180
-
181
-
182
-
183
-
184
-
185
-
186
-
187
-
188
-
189
-
190
-
191
-
192
-
193
-
194
-
195
-
196
-
197
-
198
-
199
-
200
-
201
-
 202
202 -
 203
203 -
 204
204 -
 205
205 -
 206
206 -
 207
207 -
 208
208 -
 209
209 -
 210
210 -
 211
211 -
 212
212 -
 213
213 -
 214
214 -
 215
215 -
 216
216 -
 217
217 -
 218
218 -
 219
219 -
 220
220 -
 221
221 -
 222
222 -
223
-
224
-
225
-
226
-
227
-
228
-
229
-
230
-
231
-
232
-
233
-
234
-
235
-
236
-
237
-
238
-
239
-
240
-
241
-
242
-
243
-
244
-
245
-
246
-
247
-
248
-
249
-
250
-
251
-
252
-
253
 |
 |

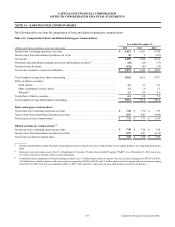
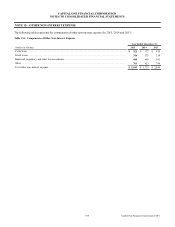
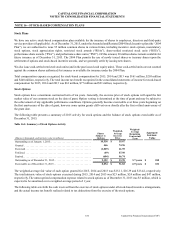
CAPITAL ONE FINANCIAL CORPORATION
NOTES TO CONSOLIDATED FINANCIAL STATEMENTS
193 Capital One Financial Corporation (COF)
Plan assets are invested using a total return investment approach whereby a mix of equity securities and debt securities are used
to preserve asset values, diversify risk and enhance our ability to achieve our benchmark for long-term investment return.
Investment strategies and asset allocations are based on careful consideration of plan liabilities, the plan’s funded status and our
financial condition. Investment performance and asset allocation are measured and monitored on a quarterly basis.
Plan assets are managed in a balanced portfolio comprised of three major components: a domestic equity portion, an international
equity portion and a domestic fixed income portion. The expected role of plan equity investments is to maximize the long-term
real growth of fund assets, while the role of fixed income investments is to generate current income, provide for more stable
periodic returns and provide some protection against a prolonged decline in the market value of fund equity investments.
The investment guidelines provide the following asset allocation targets and ranges: domestic equity target of 39% and allowable
range of 34% to 44%, international equity target of 16% and allowable range of 11% to 21%, fixed income securities target of
45% and allowable range of 35% to 55%.
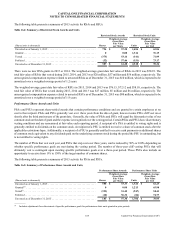
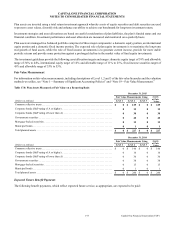
Fair Value Measurement
For information on fair value measurements, including descriptions of Level 1, 2 and 3 of the fair value hierarchy and the valuation
methods we utilize, see “Note 1—Summary of Significant Accounting Policies” and “Note 19—Fair Value Measurement.”
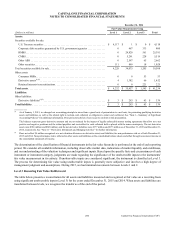
Table 17.8: Plan Assets Measured at Fair Value on a Recurring Basis
December 31, 2015
Fair Value Measurements Using Assets
at Fair
Value
(Dollars in millions) Level 1 Level 2 Level 3
Common collective trusts . . . . . . . . . . . . . . . . . . . . . . . . . . . . . . . . . . . . . . . . . . . . . . . . . . . . . . . $ 0 $ 129 $ 0 $ 129
Corporate bonds (S&P rating of A or higher). . . . . . . . . . . . . . . . . . . . . . . . . . . . . . . . . . . . . . . . 0 15 0 15
Corporate bonds (S&P rating of lower than A) . . . . . . . . . . . . . . . . . . . . . . . . . . . . . . . . . . . . . . 0 30 0 30
Government securities . . . . . . . . . . . . . . . . . . . . . . . . . . . . . . . . . . . . . . . . . . . . . . . . . . . . . . . . . 0 40 0 40
Mortgage-backed securities . . . . . . . . . . . . . . . . . . . . . . . . . . . . . . . . . . . . . . . . . . . . . . . . . . . . . 0 12 0 12
Municipal bonds . . . . . . . . . . . . . . . . . . . . . . . . . . . . . . . . . . . . . . . . . . . . . . . . . . . . . . . . . . . . . . 0 1 0 1
Total planned assets . . . . . . . . . . . . . . . . . . . . . . . . . . . . . . . . . . . . . . . . . . . . . . . . . . . . . . . . . . . $ 0 $ 227 $ 0 $ 227
December 31, 2014
Fair Value Measurements Using Assets
at Fair
Value
(Dollars in millions) Level 1 Level 2 Level 3
Common collective trusts . . . . . . . . . . . . . . . . . . . . . . . . . . . . . . . . . . . . . . . . . . . . . . . . . . . . . . . $ 0 $ 146 $ 0 $ 146
Corporate bonds (S&P rating of A or higher). . . . . . . . . . . . . . . . . . . . . . . . . . . . . . . . . . . . . . . . 0 16 0 16
Corporate bonds (S&P rating of lower than A) . . . . . . . . . . . . . . . . . . . . . . . . . . . . . . . . . . . . . . 0 30 0 30
Government securities . . . . . . . . . . . . . . . . . . . . . . . . . . . . . . . . . . . . . . . . . . . . . . . . . . . . . . . . . 0 38 0 38
Mortgage-backed securities . . . . . . . . . . . . . . . . . . . . . . . . . . . . . . . . . . . . . . . . . . . . . . . . . . . . . 0 15 0 15
Municipal bonds . . . . . . . . . . . . . . . . . . . . . . . . . . . . . . . . . . . . . . . . . . . . . . . . . . . . . . . . . . . . . . 0 1 0 1
Total planned assets . . . . . . . . . . . . . . . . . . . . . . . . . . . . . . . . . . . . . . . . . . . . . . . . . . . . . . . . . . . $ 0 $ 246 $ 0 $ 246
Expected Future Benefit Payments
The following benefit payments, which reflect expected future service, as appropriate, are expected to be paid: