Capital One 2015 Annual Report Download - page 87
Download and view the complete annual report
Please find page 87 of the 2015 Capital One annual report below. You can navigate through the pages in the report by either clicking on the pages listed below, or by using the keyword search tool below to find specific information within the annual report.-
 1
1 -
2
-
3
-
4
-
5
-
6
-
7
-
8
-
9
-
10
-
11
-
12
-
13
-
14
-
15
-
16
-
17
-
18
-
19
-
20
-
21
-
22
-
23
-
24
-
25
-
26
-
27
-
28
-
29
-
30
-
31
-
32
-
33
-
34
-
35
-
36
-
37
-
38
-
39
-
40
-
41
-
42
-
43
-
44
-
45
-
46
-
47
-
48
-
49
-
50
-
51
-
52
-
53
-
54
-
55
-
56
-
57
-
58
-
59
-
60
-
61
-
62
-
63
-
64
-
65
-
66
-
67
-
68
-
69
-
70
-
71
-
72
-
73
-
74
-
75
-
76
-
 77
77 -
 78
78 -
 79
79 -
 80
80 -
 81
81 -
 82
82 -
 83
83 -
 84
84 -
 85
85 -
 86
86 -
 87
87 -
 88
88 -
 89
89 -
 90
90 -
 91
91 -
 92
92 -
 93
93 -
 94
94 -
 95
95 -
 96
96 -
 97
97 -
98
-
99
-
100
-
101
-
102
-
103
-
104
-
105
-
106
-
107
-
108
-
109
-
110
-
111
-
112
-
113
-
114
-
115
-
116
-
117
-
118
-
119
-
120
-
121
-
122
-
123
-
124
-
125
-
126
-
127
-
128
-
129
-
130
-
131
-
132
-
133
-
134
-
135
-
136
-
137
-
138
-
139
-
140
-
141
-
142
-
143
-
144
-
145
-
146
-
147
-
148
-
149
-
150
-
151
-
152
-
153
-
154
-
155
-
156
-
157
-
158
-
159
-
160
-
161
-
162
-
163
-
164
-
165
-
166
-
167
-
168
-
169
-
170
-
171
-
172
-
173
-
174
-
175
-
176
-
177
-
178
-
179
-
180
-
181
-
182
-
183
-
184
-
185
-
186
-
187
-
188
-
189
-
190
-
191
-
192
-
193
-
194
-
195
-
196
-
197
-
198
-
199
-
200
-
201
-
202
-
203
-
204
-
205
-
206
-
207
-
208
-
209
-
210
-
211
-
212
-
213
-
214
-
215
-
216
-
217
-
218
-
219
-
220
-
221
-
222
-
223
-
224
-
225
-
226
-
227
-
228
-
229
-
230
-
231
-
232
-
233
-
234
-
235
-
236
-
237
-
238
-
239
-
240
-
241
-
242
-
243
-
244
-
245
-
246
-
247
-
248
-
249
-
250
-
251
-
252
-
253
 |
 |

68 Capital One Financial Corporation (COF)
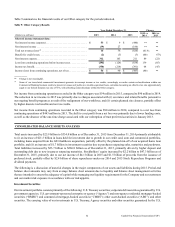
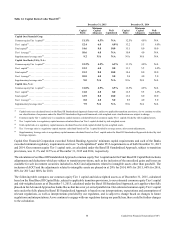
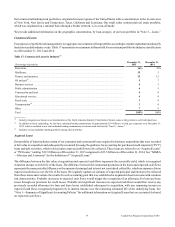
Table 14: Capital Ratios Under Basel III(1)
December 31, 2015 December 31, 2014
Capital
Ratio
Minimum
Capital
Adequacy
Well-
Capitalized
Capital
Ratio
Minimum
Capital
Adequacy
Well-
Capitalized
Capital One Financial Corp:
Common equity Tier 1 capital(2) . . . . . . . . . . . . . . . . . . . . . . . . . . 11.1% 4.5% N/A 12.5% 4.0% N/A
Tier 1 capital(3). . . . . . . . . . . . . . . . . . . . . . . . . . . . . . . . . . . . . . . . 12.4 6.0 6.0% 13.2 5.5 6.0%
Total capital(4) . . . . . . . . . . . . . . . . . . . . . . . . . . . . . . . . . . . . . . . . 14.6 8.0 10.0 15.1 8.0 10.0
Tier 1 leverage(5) . . . . . . . . . . . . . . . . . . . . . . . . . . . . . . . . . . . . . . 10.6 4.0 N/A 10.8 4.0 N/A
Supplementary leverage ratio(6) . . . . . . . . . . . . . . . . . . . . . . . . . . . 9.2 N/A N/A N/A N/A N/A
Capital One Bank (USA), N.A.:
Common equity Tier 1 capital(2) . . . . . . . . . . . . . . . . . . . . . . . . . . 12.2% 4.5% 6.5% 11.3% 4.0% N/A
Tier 1 capital(3). . . . . . . . . . . . . . . . . . . . . . . . . . . . . . . . . . . . . . . . 12.2 6.0 8.0 11.3 5.5 6.0%
Total capital(4) . . . . . . . . . . . . . . . . . . . . . . . . . . . . . . . . . . . . . . . . 15.2 8.0 10.0 14.6 8.0 10.0
Tier 1 leverage(5) . . . . . . . . . . . . . . . . . . . . . . . . . . . . . . . . . . . . . . 10.8 4.0 5.0 9.6 4.0 5.0
Supplementary leverage ratio(6) . . . . . . . . . . . . . . . . . . . . . . . . . . . 9.0 N/A N/A N/A N/A N/A
Capital One, N.A.:
Common equity Tier 1 capital(2) . . . . . . . . . . . . . . . . . . . . . . . . . . 11.8% 4.5% 6.5% 12.5% 4.0% N/A
Tier 1 capital(3). . . . . . . . . . . . . . . . . . . . . . . . . . . . . . . . . . . . . . . . 11.8 6.0 8.0 12.5 5.5 6.0%
Total capital(4) . . . . . . . . . . . . . . . . . . . . . . . . . . . . . . . . . . . . . . . . 12.9 8.0 10.0 13.6 8.0 10.0
Tier 1 leverage(5) . . . . . . . . . . . . . . . . . . . . . . . . . . . . . . . . . . . . . . 8.8 4.0 5.0 8.9 4.0 5.0
Supplementary leverage ratio(6) . . . . . . . . . . . . . . . . . . . . . . . . . . . 7.9 N/A N/A N/A N/A N/A
__________
(1) Capital ratios are calculated based on the Basel III Standardized Approach framework, subject to applicable transition provisions. As we continue to refine
our classification of exposures under the Basel III Standardized Approach framework, risk-weighted asset classifications are subject to change.
(2) Common equity Tier 1 capital ratio is a regulatory capital measure calculated based on common equity Tier 1 capital divided by risk-weighted assets.
(3) Tier 1 capital ratio is a regulatory capital measure calculated based on Tier 1 capital divided by risk-weighted assets.
(4) Total capital ratio is a regulatory capital measure calculated based on total capital divided by risk-weighted assets.
(5) Tier 1 leverage ratio is a regulatory capital measure calculated based on Tier 1 capital divided by average assets, after certain adjustments.
(6) Supplementary leverage ratio is a regulatory capital measure calculated based on Tier 1 capital under the Basel III Standardized Approach divided by total
leverage exposure.
Capital One Financial Corporation exceeded Federal Banking Agencies’ minimum capital requirements and each of the Banks
exceeded minimum regulatory requirements and were “well-capitalized” under PCA requirements as of both December 31, 2015
and 2014. Our common equity Tier 1 capital ratio, as calculated under the Basel III Standardized Approach, subject to transition
provisions, was 11.1% and 12.5% as of December 31, 2015 and 2014, respectively.
The calculation of our Basel III Standardized Approach common equity Tier 1 capital under the Final Basel III Capital Rule includes
adjustments and deductions which are subject to transition provisions, such as the inclusion of the unrealized gains and losses on
available for sale investment securities included in AOCI and adjustments related to intangible assets other than goodwill. The
inclusion of AOCI and the adjustments related to intangible assets are phased-in at 20% for 2014, 40% for 2015, 60% for 2016,
80% for 2017 and 100% for 2018.
The following table compares our common equity Tier 1 capital and risk-weighted assets as of December 31, 2015, calculated
based on the Final Basel III Capital Rule, subject to applicable transition provisions, to our estimated common equity Tier 1 capital
and risk-weighted assets as of December 31, 2015, calculated under the Basel III Standardized Approach, as it applies when fully
phased-in for Advanced Approaches banks like us that have not yet exited parallel run. Our estimated common equity Tier 1 capital
ratio under the fully phased-in Basel III Standardized Approach is based on our interpretations, expectations and assumptions of
relevant regulations, as well as interpretations provided by our regulators, and is subject to change based on changes to future
regulations and interpretations. As we continue to engage with our regulators during our parallel run, there could be further changes
to the calculation.