Capital One 2015 Annual Report Download - page 101
Download and view the complete annual report
Please find page 101 of the 2015 Capital One annual report below. You can navigate through the pages in the report by either clicking on the pages listed below, or by using the keyword search tool below to find specific information within the annual report.-
 1
1 -
2
-
3
-
4
-
5
-
6
-
7
-
8
-
9
-
10
-
11
-
12
-
13
-
14
-
15
-
16
-
17
-
18
-
19
-
20
-
21
-
22
-
23
-
24
-
25
-
26
-
27
-
28
-
29
-
30
-
31
-
32
-
33
-
34
-
35
-
36
-
37
-
38
-
39
-
40
-
41
-
42
-
43
-
44
-
45
-
46
-
47
-
48
-
49
-
50
-
51
-
52
-
53
-
54
-
55
-
56
-
57
-
58
-
59
-
60
-
61
-
62
-
63
-
64
-
65
-
66
-
67
-
68
-
69
-
70
-
71
-
72
-
73
-
74
-
75
-
76
-
77
-
78
-
79
-
80
-
81
-
82
-
83
-
84
-
85
-
86
-
87
-
88
-
89
-
90
-
 91
91 -
 92
92 -
 93
93 -
 94
94 -
 95
95 -
 96
96 -
 97
97 -
 98
98 -
 99
99 -
 100
100 -
 101
101 -
 102
102 -
 103
103 -
 104
104 -
 105
105 -
 106
106 -
 107
107 -
 108
108 -
 109
109 -
 110
110 -
 111
111 -
112
-
113
-
114
-
115
-
116
-
117
-
118
-
119
-
120
-
121
-
122
-
123
-
124
-
125
-
126
-
127
-
128
-
129
-
130
-
131
-
132
-
133
-
134
-
135
-
136
-
137
-
138
-
139
-
140
-
141
-
142
-
143
-
144
-
145
-
146
-
147
-
148
-
149
-
150
-
151
-
152
-
153
-
154
-
155
-
156
-
157
-
158
-
159
-
160
-
161
-
162
-
163
-
164
-
165
-
166
-
167
-
168
-
169
-
170
-
171
-
172
-
173
-
174
-
175
-
176
-
177
-
178
-
179
-
180
-
181
-
182
-
183
-
184
-
185
-
186
-
187
-
188
-
189
-
190
-
191
-
192
-
193
-
194
-
195
-
196
-
197
-
198
-
199
-
200
-
201
-
202
-
203
-
204
-
205
-
206
-
207
-
208
-
209
-
210
-
211
-
212
-
213
-
214
-
215
-
216
-
217
-
218
-
219
-
220
-
221
-
222
-
223
-
224
-
225
-
226
-
227
-
228
-
229
-
230
-
231
-
232
-
233
-
234
-
235
-
236
-
237
-
238
-
239
-
240
-
241
-
242
-
243
-
244
-
245
-
246
-
247
-
248
-
249
-
250
-
251
-
252
-
253
 |
 |

82 Capital One Financial Corporation (COF)
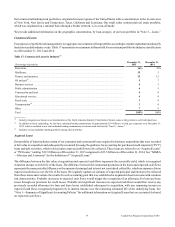
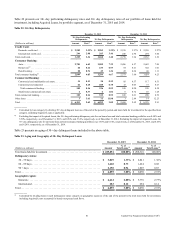
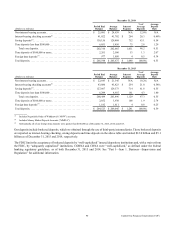
Table 24 summarizes loans that were 90+ days delinquent as to interest or principal and still accruing interest as of December 31,
2015 and 2014. These loans consist primarily of credit card accounts between 90 days and 179 days past due. As permitted by
regulatory guidance issued by the FFIEC, we continue to accrue interest and fees on domestic credit card loans through the date
of charge-off, which is typically in the period the account becomes 180 days past due. While domestic credit card loans typically
remain on accrual status until the loan is charged-off, we reduce the balance of our credit card receivables by the amount of finance
charges and fees billed but not expected to be collected and exclude this amount from revenue.
Table 24: 90+ Day Delinquent Loans Accruing Interest
December 31, 2015 December 31, 2014
(Dollars in millions) Amount
% of
Total Loans(1) Amount
% of
Total Loans(1)
Loan category:
Credit card. . . . . . . . . . . . . . . . . . . . . . . . . . . . . . . . . . . . . . . . . . . . . . . . . . . . . . . . . $ 1,500 1.56% $ 1,254 1.46%
Consumer banking . . . . . . . . . . . . . . . . . . . . . . . . . . . . . . . . . . . . . . . . . . . . . . . . . . — 0.00 1 0.00
Commercial banking. . . . . . . . . . . . . . . . . . . . . . . . . . . . . . . . . . . . . . . . . . . . . . . . . 5 0.01 8 0.01
Total . . . . . . . . . . . . . . . . . . . . . . . . . . . . . . . . . . . . . . . . . . . . . . . . . . . . . . . . . . . . . . . . $ 1,505 0.65 $ 1,263 0.61
Geographic region:
Domestic . . . . . . . . . . . . . . . . . . . . . . . . . . . . . . . . . . . . . . . . . . . . . . . . . . . . . . . . . . $ 1,426 0.64% $ 1,190 0.59%
International . . . . . . . . . . . . . . . . . . . . . . . . . . . . . . . . . . . . . . . . . . . . . . . . . . . . . . . 79 0.96 73 0.90
Total . . . . . . . . . . . . . . . . . . . . . . . . . . . . . . . . . . . . . . . . . . . . . . . . . . . . . . . . . . . . . . . . $ 1,505 0.65 $ 1,263 0.61
__________
(1) Delinquency rates are calculated for each loan category by dividing 90+ day delinquent loans accruing interest by period-end loans held for investment for
the specified loan category.
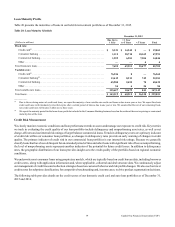
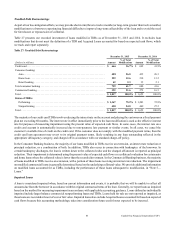
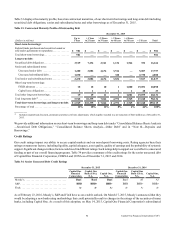
Nonperforming Loans and Nonperforming Assets
Nonperforming assets consist of nonperforming loans, foreclosed property and repossessed assets and the net realizable value of
auto loans that have been charged-off as a result of a bankruptcy. Nonperforming loans include loans that have been placed on
nonaccrual status. See “Note 1—Summary of Significant Accounting Policies” for information on our policies for classifying loans
as nonperforming for each of our loan categories.
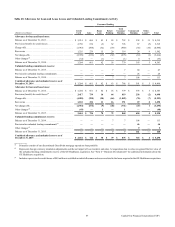
Table 25 presents comparative information on nonperforming loans, by portfolio segment, and other nonperforming assets as of
December 31, 2015 and 2014. We do not classify loans held for sale as nonperforming, as they are recorded at the lower of cost
or fair value. We provide additional information on our credit quality metrics above under “Business Segment Financial
Performance.”