Capital One 2015 Annual Report Download - page 52
Download and view the complete annual report
Please find page 52 of the 2015 Capital One annual report below. You can navigate through the pages in the report by either clicking on the pages listed below, or by using the keyword search tool below to find specific information within the annual report.
33 Capital One Financial Corporation (COF)
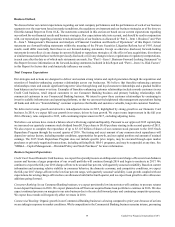
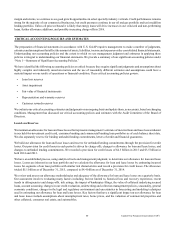
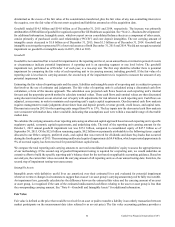
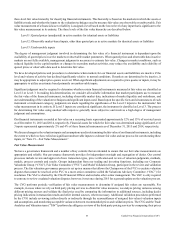
Item 6. Summary of Selected Financial Data
The following table presents selected consolidated financial data and performance metrics for the five-year period ended
December 31, 2015. Certain prior period amounts have been recast to conform to the current period presentation. We prepare our
consolidated financial statements based on U.S. GAAP. This data should be reviewed in conjunction with our audited consolidated
financial statements and related notes and with the MD&A included in this Report. The historical financial information presented
may not be indicative of our future performance.
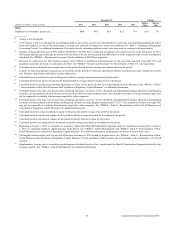
Five-Year Summary of Selected Financial Data(1)
Year Ended December 31, Change
(Dollars in millions, except per share data and as noted) 2015 2014 2013 2012 2011
2015 vs.
2014
2014 vs.
2013
Income statement
Interest income . . . . . . . . . . . . . . . . . . . . . . . . . . . . . . . . . . . . . . $ 20,459 $ 19,397 $ 19,898 $ 18,964 $ 14,987 5% (3)%
Interest expense . . . . . . . . . . . . . . . . . . . . . . . . . . . . . . . . . . . . . 1,625 1,579 1,792 2,375 2,246 3 (12)
Net interest income. . . . . . . . . . . . . . . . . . . . . . . . . . . . . . . . . . . 18,834 17,818 18,106 16,589 12,741 6 (2)
Non-interest income(2) . . . . . . . . . . . . . . . . . . . . . . . . . . . . . . . . 4,579 4,472 4,278 4,807 3,538 2 5
Total net revenue . . . . . . . . . . . . . . . . . . . . . . . . . . . . . . . . . . . . 23,413 22,290 22,384 21,396 16,279 5 —
Provision for credit losses(3) . . . . . . . . . . . . . . . . . . . . . . . . . . . . 4,536 3,541 3,453 4,415 2,360 28 3
Non-interest expense:
Marketing . . . . . . . . . . . . . . . . . . . . . . . . . . . . . . . . . . . . . . . 1,744 1,561 1,373 1,364 1,337 12 14
Amortization of intangibles . . . . . . . . . . . . . . . . . . . . . . . . . 430 532 671 609 222 (19) (21)
Operating expenses. . . . . . . . . . . . . . . . . . . . . . . . . . . . . . . . 10,822 10,087 10,309 9,824 7,672 7 (2)
Total non-interest expense . . . . . . . . . . . . . . . . . . . . . . . . . . . . . 12,996 12,180 12,353 11,797 9,231 7 (1)
Income from continuing operations before income taxes . . . . . 5,881 6,569 6,578 5,184 4,688 (10) —
Income tax provision . . . . . . . . . . . . . . . . . . . . . . . . . . . . . . . . . 1,869 2,146 2,224 1,475 1,452 (13) (4)
Income from continuing operations, net of tax . . . . . . . . . . . . . 4,012 4,423 4,354 3,709 3,236 (9) 2
Income (loss) from discontinued operations, net of tax . . . . . . . 38 5 (233) (217) (106) ** **
Net income . . . . . . . . . . . . . . . . . . . . . . . . . . . . . . . . . . . . . . . . . 4,050 4,428 4,121 3,492 3,130 (9) 7
Dividends and undistributed earnings allocated to
participating securities . . . . . . . . . . . . . . . . . . . . . . . . . . . . . . . . (20) (18) (17) (15) (26) 11 6
Preferred stock dividends . . . . . . . . . . . . . . . . . . . . . . . . . . . . . . (158) (67) (53) (15) — 136 26
Net income available to common stockholders . . . . . . . . . . . . . $ 3,872 $ 4,343 $ 4,051 $ 3,462 $ 3,104 (11) 7
Common share statistics
Basic earnings per common share:
Net income from continuing operations. . . . . . . . . . . . . . . . $ 7.08 $ 7.70 $ 7.39 $ 6.56 $ 7.04 (8)% 4%
Income (loss) from discontinued operations . . . . . . . . . . . . 0.07 0.01 (0.40) (0.39) (0.23) ** **
Net income per basic common share . . . . . . . . . . . . . . . . . . $ 7.15 $ 7.71 $ 6.99 $ 6.17 $ 6.81 (7) 10
Diluted earnings per common share:
Net income from continuing operations. . . . . . . . . . . . . . . . $ 7.00 $ 7.58 $ 7.28 $ 6.49 $ 6.99 (8) 4
Income (loss) from discontinued operations . . . . . . . . . . . . 0.07 0.01 (0.39) (0.38) (0.23) ** **
Net income per diluted common share. . . . . . . . . . . . . . . . . $ 7.07 $ 7.59 $ 6.89 $ 6.11 $ 6.76 (7) 10
Common shares outstanding (period end, in millions). . . . . . . . 527.3 553.4 572.7 582.2 459.9 (5) (3)
Dividends paid per common share . . . . . . . . . . . . . . . . . . . . . . . $ 1.50 $ 1.20 $ 0.95 $ 0.20 $ 0.20 25 26
Tangible book value per common share (period end) . . . . . . . . 53.65 50.32 43.64 40.10 34.16 7 15
Common dividend payout ratio(4) . . . . . . . . . . . . . . . . . . . . . . . . 20.98% 15.56% 13.59% 3.24% 2.93% 542bps 197bps
Stock price per common share at period end . . . . . . . . . . . . . . . $ 72.18 $ 82.55 $ 76.61 $ 57.93 $ 42.29 (13)% 8%
Book value per common share at period end . . . . . . . . . . . . . . . 89.67 81.41 72.69 69.43 64.40 10 12
Total market capitalization at period end . . . . . . . . . . . . . . . . . . 38,061 45,683 43,875 33,727 19,301 (17) 4


