Capital One 2015 Annual Report Download - page 187
Download and view the complete annual report
Please find page 187 of the 2015 Capital One annual report below. You can navigate through the pages in the report by either clicking on the pages listed below, or by using the keyword search tool below to find specific information within the annual report.-
 1
1 -
2
-
3
-
4
-
5
-
6
-
7
-
8
-
9
-
10
-
11
-
12
-
13
-
14
-
15
-
16
-
17
-
18
-
19
-
20
-
21
-
22
-
23
-
24
-
25
-
26
-
27
-
28
-
29
-
30
-
31
-
32
-
33
-
34
-
35
-
36
-
37
-
38
-
39
-
40
-
41
-
42
-
43
-
44
-
45
-
46
-
47
-
48
-
49
-
50
-
51
-
52
-
53
-
54
-
55
-
56
-
57
-
58
-
59
-
60
-
61
-
62
-
63
-
64
-
65
-
66
-
67
-
68
-
69
-
70
-
71
-
72
-
73
-
74
-
75
-
76
-
77
-
78
-
79
-
80
-
81
-
82
-
83
-
84
-
85
-
86
-
87
-
88
-
89
-
90
-
91
-
92
-
93
-
94
-
95
-
96
-
97
-
98
-
99
-
100
-
101
-
102
-
103
-
104
-
105
-
106
-
107
-
108
-
109
-
110
-
111
-
112
-
113
-
114
-
115
-
116
-
117
-
118
-
119
-
120
-
121
-
122
-
123
-
124
-
125
-
126
-
127
-
128
-
129
-
130
-
131
-
132
-
133
-
134
-
135
-
136
-
137
-
138
-
139
-
140
-
141
-
142
-
143
-
144
-
145
-
146
-
147
-
148
-
149
-
150
-
151
-
152
-
153
-
154
-
155
-
156
-
157
-
158
-
159
-
160
-
161
-
162
-
163
-
164
-
165
-
166
-
167
-
168
-
169
-
170
-
171
-
172
-
173
-
174
-
175
-
176
-
 177
177 -
 178
178 -
 179
179 -
 180
180 -
 181
181 -
 182
182 -
 183
183 -
 184
184 -
 185
185 -
 186
186 -
 187
187 -
 188
188 -
 189
189 -
 190
190 -
 191
191 -
 192
192 -
 193
193 -
 194
194 -
 195
195 -
 196
196 -
 197
197 -
198
-
199
-
200
-
201
-
202
-
203
-
204
-
205
-
206
-
207
-
208
-
209
-
210
-
211
-
212
-
213
-
214
-
215
-
216
-
217
-
218
-
219
-
220
-
221
-
222
-
223
-
224
-
225
-
226
-
227
-
228
-
229
-
230
-
231
-
232
-
233
-
234
-
235
-
236
-
237
-
238
-
239
-
240
-
241
-
242
-
243
-
244
-
245
-
246
-
247
-
248
-
249
-
250
-
251
-
252
-
253
 |
 |

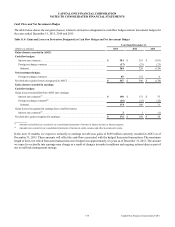
CAPITAL ONE FINANCIAL CORPORATION
NOTES TO CONSOLIDATED FINANCIAL STATEMENTS
168 Capital One Financial Corporation (COF)
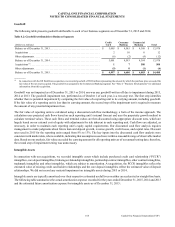
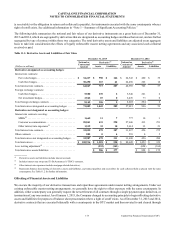
Goodwill
The following table presents goodwill attributable to each of our business segments as of December 31, 2015 and 2014.
Table 8.2: Goodwill Attributable to Business Segments
(Dollars in millions)
Credit
Card
Consumer
Banking
Commercial
Banking Total
Balance as of December 31, 2013. . . . . . . . . . . . . . . . . . . . . . . . . . . . . . . . . . . . . . . $ 5,005 $ 4,585 $ 4,388 $ 13,978
Acquisitions . . . . . . . . . . . . . . . . . . . . . . . . . . . . . . . . . . . . . . . . . . . . . . . . . . . . . . . 2 10 0 12
Other adjustments . . . . . . . . . . . . . . . . . . . . . . . . . . . . . . . . . . . . . . . . . . . . . . . . . . . (6) (2) (4) (12)
Balance as of December 31, 2014. . . . . . . . . . . . . . . . . . . . . . . . . . . . . . . . . . . . . . . 5,001 4,593 4,384 13,978
Acquisitions (1). . . . . . . . . . . . . . . . . . . . . . . . . . . . . . . . . . . . . . . . . . . . . . . . . . . . . . 1 7 500 508
Other adjustments . . . . . . . . . . . . . . . . . . . . . . . . . . . . . . . . . . . . . . . . . . . . . . . . . . . (5) 0 (1) (6)
Balance as of December 31, 2015. . . . . . . . . . . . . . . . . . . . . . . . . . . . . . . . . . . . . . . $ 4,997 $ 4,600 $ 4,883 $ 14,480
__________
(1) In connection with the GE Healthcare acquisition, we recorded goodwill of $500 million representing the amount by which the purchase price exceeded the
fair value of the net assets acquired. The goodwill was assigned to the Commercial Banking segment. See “Note 2—Business Developments” for additional
information about this acquisition.
Goodwill was not impaired as of December 31, 2015 or 2014, nor was any goodwill written off due to impairment during 2015,
2014 or 2013. The goodwill impairment test, performed as of October 1 of each year, is a two-step test. The first step identifies
whether there is potential impairment by comparing the fair value of a reporting unit to its carrying amount, including goodwill.
If the fair value of a reporting unit is less than its carrying amount, the second step of the impairment test is required to measure
the amount of any potential impairment loss.
The fair value of reporting units is calculated using a discounted cash flow methodology, a form of the income approach. The
calculation uses projected cash flows based on each reporting unit’s internal forecast and uses the perpetuity growth method to
calculate terminal values. These cash flows and terminal values are then discounted using appropriate discount rates, which are
largely based on our external cost of equity with adjustments for risk inherent in each reporting unit. Cash flows are adjusted, as
necessary, in order to maintain each reporting unit’s equity capital requirements. Our discounted cash flow analysis requires
management to make judgments about future loan and deposit growth, revenue growth, credit losses, and capital rates. Discount
rates used in 2015 for the reporting units ranged from 8% to 13%. The key inputs into the discounted cash flow analysis were
consistent with market data, where available, indicating that assumptions used were within a reasonable range of observable market
data. Based on our analysis, fair value exceeded the carrying amount for all reporting units as of our annual testing date; therefore,
the second step of impairment testing was unnecessary.
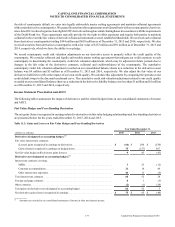
Intangible Assets
In connection with our acquisitions, we recorded intangible assets which include purchased credit card relationship (“PCCR”)
intangibles, core deposit intangibles, brokerage relationship intangibles, partnership contract intangibles, other contract intangibles,
trademark intangibles and other intangibles, which are subject to amortization. At acquisition, the PCCR intangibles reflect the
estimated value of existing credit card holder relationships and the core deposit intangibles reflect the estimated value of deposit
relationships. We did not record any material impairment on intangible assets during 2015 or 2014.
Intangible assets are typically amortized over their respective estimated useful lives on either an accelerated or straight-line basis.
The following table summarizes the actual amortization expense recorded for the years ended December 31, 2015, 2014 and 2013
and the estimated future amortization expense for intangible assets as of December 31, 2015: