Capital One 2015 Annual Report Download - page 223
Download and view the complete annual report
Please find page 223 of the 2015 Capital One annual report below. You can navigate through the pages in the report by either clicking on the pages listed below, or by using the keyword search tool below to find specific information within the annual report.-
 1
1 -
2
-
3
-
4
-
5
-
6
-
7
-
8
-
9
-
10
-
11
-
12
-
13
-
14
-
15
-
16
-
17
-
18
-
19
-
20
-
21
-
22
-
23
-
24
-
25
-
26
-
27
-
28
-
29
-
30
-
31
-
32
-
33
-
34
-
35
-
36
-
37
-
38
-
39
-
40
-
41
-
42
-
43
-
44
-
45
-
46
-
47
-
48
-
49
-
50
-
51
-
52
-
53
-
54
-
55
-
56
-
57
-
58
-
59
-
60
-
61
-
62
-
63
-
64
-
65
-
66
-
67
-
68
-
69
-
70
-
71
-
72
-
73
-
74
-
75
-
76
-
77
-
78
-
79
-
80
-
81
-
82
-
83
-
84
-
85
-
86
-
87
-
88
-
89
-
90
-
91
-
92
-
93
-
94
-
95
-
96
-
97
-
98
-
99
-
100
-
101
-
102
-
103
-
104
-
105
-
106
-
107
-
108
-
109
-
110
-
111
-
112
-
113
-
114
-
115
-
116
-
117
-
118
-
119
-
120
-
121
-
122
-
123
-
124
-
125
-
126
-
127
-
128
-
129
-
130
-
131
-
132
-
133
-
134
-
135
-
136
-
137
-
138
-
139
-
140
-
141
-
142
-
143
-
144
-
145
-
146
-
147
-
148
-
149
-
150
-
151
-
152
-
153
-
154
-
155
-
156
-
157
-
158
-
159
-
160
-
161
-
162
-
163
-
164
-
165
-
166
-
167
-
168
-
169
-
170
-
171
-
172
-
173
-
174
-
175
-
176
-
177
-
178
-
179
-
180
-
181
-
182
-
183
-
184
-
185
-
186
-
187
-
188
-
189
-
190
-
191
-
192
-
193
-
194
-
195
-
196
-
197
-
198
-
199
-
200
-
201
-
202
-
203
-
204
-
205
-
206
-
207
-
208
-
209
-
210
-
211
-
212
-
 213
213 -
 214
214 -
 215
215 -
 216
216 -
 217
217 -
 218
218 -
 219
219 -
 220
220 -
 221
221 -
 222
222 -
 223
223 -
 224
224 -
 225
225 -
 226
226 -
 227
227 -
 228
228 -
 229
229 -
 230
230 -
 231
231 -
 232
232 -
 233
233 -
234
-
235
-
236
-
237
-
238
-
239
-
240
-
241
-
242
-
243
-
244
-
245
-
246
-
247
-
248
-
249
-
250
-
251
-
252
-
253
 |
 |

CAPITAL ONE FINANCIAL CORPORATION
NOTES TO CONSOLIDATED FINANCIAL STATEMENTS
204 Capital One Financial Corporation (COF)
December 31, 2014
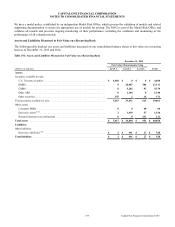
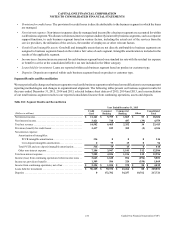
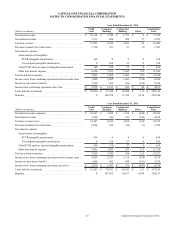
Estimated Fair Value Hierarchy
Total
(Dollars in millions) Level 1 Level 2 Level 3
Loans held for investment. . . . . . . . . . . . . . . . . . . . . . . . . . . . . . . . . . . . . . . . . . . . . . . . . . . . . $ 0 $ 0 $ 121 $ 121
Loans held for sale . . . . . . . . . . . . . . . . . . . . . . . . . . . . . . . . . . . . . . . . . . . . . . . . . . . . . . . . . . 0 34 0 34
Other assets(1) . . . . . . . . . . . . . . . . . . . . . . . . . . . . . . . . . . . . . . . . . . . . . . . . . . . . . . . . . . . . . . 0 0 65 65
Total . . . . . . . . . . . . . . . . . . . . . . . . . . . . . . . . . . . . . . . . . . . . . . . . . . . . . . . . . . . . . . . . . . . . . $ 0 $ 34 $ 186 $ 220
__________
(1) Includes foreclosed property and repossessed assets of $54 million and long-lived assets held for sale of $38 million as of December 31, 2015, compared to
foreclosed property and repossessed assets of $60 million and long-lived assets held for sale of $5 million as of December 31, 2014.
In the above table, loans held for investment primarily include nonperforming loans for which specific reserves or charge-offs
have been recognized. These loans are classified as Level 3 as they are valued based in part on the estimated fair value of the
underlying collateral and the non-recoverable rate, which is considered to be a significant unobservable input. Collateral fair value
sources include the appraisal value obtained from independent appraisers, broker pricing opinions or other available market
information. The non-recoverable rate ranged from 9% to 73%, with a weighted average of 20%, and from 0% to 74%, with a
weighted average of 30%, as of December 31, 2015 and 2014, respectively. The fair value of the other assets classified as Level
3 is determined based on appraisal value or listing price which involves significant judgment; the significant unobservable inputs
and related quantitative information are not meaningful to disclose as they vary significantly across properties and collateral.
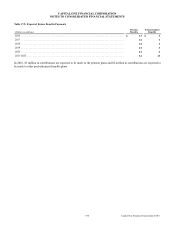
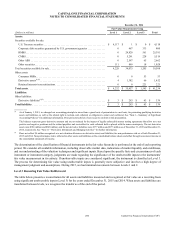
The following table presents total nonrecurring fair value measurements for the period, included in earnings, attributable to the
change in fair value relating to assets that are still held at December 31, 2015 and 2014:
Table 19.5: Nonrecurring Fair Value Measurements Included in Earnings Related to Assets Still Held at Period End
Total Losses
Year Ended December 31,
(Dollars in millions) 2015 2014
Loans held for investment . . . . . . . . . . . . . . . . . . . . . . . . . . . . . . . . . . . . . . . . . . . . . . . . . . . . . . . . . . . . . . . $ (80) $ (24)
Loans held for sale. . . . . . . . . . . . . . . . . . . . . . . . . . . . . . . . . . . . . . . . . . . . . . . . . . . . . . . . . . . . . . . . . . . . . (1) 0
Other assets(1) . . . . . . . . . . . . . . . . . . . . . . . . . . . . . . . . . . . . . . . . . . . . . . . . . . . . . . . . . . . . . . . . . . . . . . . . . (45) (12)
Total. . . . . . . . . . . . . . . . . . . . . . . . . . . . . . . . . . . . . . . . . . . . . . . . . . . . . . . . . . . . . . . . . . . . . . . . . . . . . . . . $ (126) $ (36)
__________
(1) Includes losses related to foreclosed property, repossessed assets and long-lived assets.
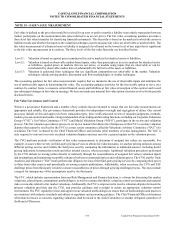
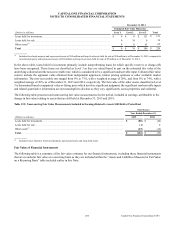
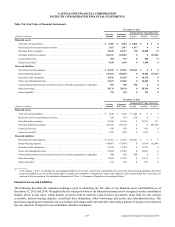
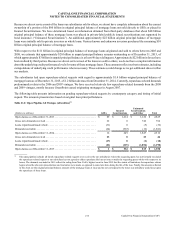
Fair Value of Financial Instruments
The following table is a summary of the fair value estimates for our financial instruments, excluding those financial instruments
that are recorded at fair value on a recurring basis as they are included within the “Assets and Liabilities Measured at Fair Value
on a Recurring Basis” table included earlier in this Note.