Capital One 2015 Annual Report Download - page 55
Download and view the complete annual report
Please find page 55 of the 2015 Capital One annual report below. You can navigate through the pages in the report by either clicking on the pages listed below, or by using the keyword search tool below to find specific information within the annual report.-
 1
1 -
2
-
3
-
4
-
5
-
6
-
7
-
8
-
9
-
10
-
11
-
12
-
13
-
14
-
15
-
16
-
17
-
18
-
19
-
20
-
21
-
22
-
23
-
24
-
25
-
26
-
27
-
28
-
29
-
30
-
31
-
32
-
33
-
34
-
35
-
36
-
37
-
38
-
39
-
40
-
41
-
42
-
43
-
44
-
 45
45 -
 46
46 -
 47
47 -
 48
48 -
 49
49 -
 50
50 -
 51
51 -
 52
52 -
 53
53 -
 54
54 -
 55
55 -
 56
56 -
 57
57 -
 58
58 -
 59
59 -
 60
60 -
 61
61 -
 62
62 -
 63
63 -
 64
64 -
 65
65 -
66
-
67
-
68
-
69
-
70
-
71
-
72
-
73
-
74
-
75
-
76
-
77
-
78
-
79
-
80
-
81
-
82
-
83
-
84
-
85
-
86
-
87
-
88
-
89
-
90
-
91
-
92
-
93
-
94
-
95
-
96
-
97
-
98
-
99
-
100
-
101
-
102
-
103
-
104
-
105
-
106
-
107
-
108
-
109
-
110
-
111
-
112
-
113
-
114
-
115
-
116
-
117
-
118
-
119
-
120
-
121
-
122
-
123
-
124
-
125
-
126
-
127
-
128
-
129
-
130
-
131
-
132
-
133
-
134
-
135
-
136
-
137
-
138
-
139
-
140
-
141
-
142
-
143
-
144
-
145
-
146
-
147
-
148
-
149
-
150
-
151
-
152
-
153
-
154
-
155
-
156
-
157
-
158
-
159
-
160
-
161
-
162
-
163
-
164
-
165
-
166
-
167
-
168
-
169
-
170
-
171
-
172
-
173
-
174
-
175
-
176
-
177
-
178
-
179
-
180
-
181
-
182
-
183
-
184
-
185
-
186
-
187
-
188
-
189
-
190
-
191
-
192
-
193
-
194
-
195
-
196
-
197
-
198
-
199
-
200
-
201
-
202
-
203
-
204
-
205
-
206
-
207
-
208
-
209
-
210
-
211
-
212
-
213
-
214
-
215
-
216
-
217
-
218
-
219
-
220
-
221
-
222
-
223
-
224
-
225
-
226
-
227
-
228
-
229
-
230
-
231
-
232
-
233
-
234
-
235
-
236
-
237
-
238
-
239
-
240
-
241
-
242
-
243
-
244
-
245
-
246
-
247
-
248
-
249
-
250
-
251
-
252
-
253
 |
 |

36 Capital One Financial Corporation (COF)
Item 7. Management’s Discussion and Analysis of Financial Condition and Results of Operations (“MD&A”)
This discussion contains forward-looking statements that are based upon management’s current expectations and are subject to
significant uncertainties and changes in circumstances. Please review “Forward-Looking Statements” for more information on
the forward-looking statements in this 2015 Annual Report on Form 10-K (“this Report”). Our actual results may differ materially
from those included in these forward-looking statements due to a variety of factors including, but not limited to, those described
in “Part I—Item 1A. Risk Factors” in this Report. Unless otherwise specified, references to notes to our consolidated financial
statements refer to the notes to our consolidated financial statements as of December 31, 2015 included in this Report.
Management monitors a variety of key indicators to evaluate our business results and financial condition. The following MD&A
is intended to provide the reader with an understanding of our results of operations, financial condition and liquidity by focusing
on changes from year to year in certain key measures used by management to evaluate performance, such as profitability, growth
and credit quality metrics. MD&A is provided as a supplement to, and should be read in conjunction with, our audited consolidated
financial statements as of and for the year ended December 31, 2015 and accompanying notes. MD&A is organized in the following
sections:
• Executive Summary and Business Outlook • Capital Management
• Critical Accounting Policies and Estimates • Risk Management
• Accounting Changes and Developments • Credit Risk Profile
• Consolidated Results of Operations • Liquidity Risk Profile
• Business Segment Financial Performance • Market Risk Profile
• Consolidated Balance Sheets Analysis • Supplemental Tables
• Off-Balance Sheet Arrangements and Variable Interest Entities • Glossary and Acronyms
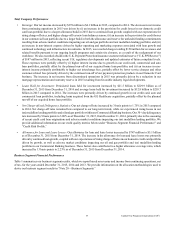
EXECUTIVE SUMMARY AND BUSINESS OUTLOOK
In 2015 all three of our business segments delivered strong underlying performance. We continue to deliver attractive risk-adjusted
returns while investing to improve profitability.
Financial Highlights
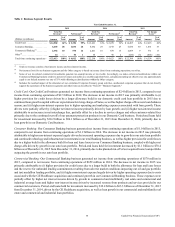
We reported net income of $4.1 billion ($7.07 per diluted common share) on total net revenue of $23.4 billion for 2015. In
comparison, we reported net income of $4.4 billion ($7.59 per diluted common share) on total net revenue of $22.3 billion for
2014 and $4.1 billion ($6.89 per diluted common share) on total net revenue of $22.4 billion for 2013.
Our common equity Tier 1 capital ratio, as calculated under the Basel III Standardized Approach, including transition provisions,
was 11.1% and 12.5% as of December 31, 2015 and 2014, respectively. We formally entered parallel run for Basel III Advanced
Approaches on January 1, 2015. See “MD&A—Capital Management” below for additional information.
On March 11, 2015, we announced that our Board of Directors authorized the repurchase of up to $3.125 billion of shares of our
common stock (“2015 Stock Repurchase Program”). Through the end of 2015, we repurchased approximately $1.875 billion of
shares of common stock as part of this program and expect to complete the 2015 Stock Repurchase Program by the end of the
second quarter of 2016. On February 17, 2016, we announced that our Board of Directors had authorized the repurchase of up to
an additional $300 million of shares of common stock through the end of the second quarter of 2016 under the 2015 Stock
Repurchase Program. See “MD&A—Capital Management” below for additional information.
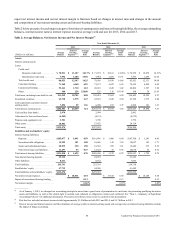
Below are additional highlights of our performance in 2015. These highlights are generally based on a comparison between the
results of 2015 and 2014, except as otherwise noted. The changes in our financial condition and credit performance are generally
based on our financial condition and credit performance as of December 31, 2015, compared to our financial condition and credit
performance as of December 31, 2014. We provide a more detailed discussion of our financial performance in the sections following
this “Executive Summary and Business Outlook.”