Capital One 2015 Annual Report Download - page 196
Download and view the complete annual report
Please find page 196 of the 2015 Capital One annual report below. You can navigate through the pages in the report by either clicking on the pages listed below, or by using the keyword search tool below to find specific information within the annual report.-
 1
1 -
2
-
3
-
4
-
5
-
6
-
7
-
8
-
9
-
10
-
11
-
12
-
13
-
14
-
15
-
16
-
17
-
18
-
19
-
20
-
21
-
22
-
23
-
24
-
25
-
26
-
27
-
28
-
29
-
30
-
31
-
32
-
33
-
34
-
35
-
36
-
37
-
38
-
39
-
40
-
41
-
42
-
43
-
44
-
45
-
46
-
47
-
48
-
49
-
50
-
51
-
52
-
53
-
54
-
55
-
56
-
57
-
58
-
59
-
60
-
61
-
62
-
63
-
64
-
65
-
66
-
67
-
68
-
69
-
70
-
71
-
72
-
73
-
74
-
75
-
76
-
77
-
78
-
79
-
80
-
81
-
82
-
83
-
84
-
85
-
86
-
87
-
88
-
89
-
90
-
91
-
92
-
93
-
94
-
95
-
96
-
97
-
98
-
99
-
100
-
101
-
102
-
103
-
104
-
105
-
106
-
107
-
108
-
109
-
110
-
111
-
112
-
113
-
114
-
115
-
116
-
117
-
118
-
119
-
120
-
121
-
122
-
123
-
124
-
125
-
126
-
127
-
128
-
129
-
130
-
131
-
132
-
133
-
134
-
135
-
136
-
137
-
138
-
139
-
140
-
141
-
142
-
143
-
144
-
145
-
146
-
147
-
148
-
149
-
150
-
151
-
152
-
153
-
154
-
155
-
156
-
157
-
158
-
159
-
160
-
161
-
162
-
163
-
164
-
165
-
166
-
167
-
168
-
169
-
170
-
171
-
172
-
173
-
174
-
175
-
176
-
177
-
178
-
179
-
180
-
181
-
182
-
183
-
184
-
185
-
 186
186 -
 187
187 -
 188
188 -
 189
189 -
 190
190 -
 191
191 -
 192
192 -
 193
193 -
 194
194 -
 195
195 -
 196
196 -
 197
197 -
 198
198 -
 199
199 -
 200
200 -
 201
201 -
 202
202 -
 203
203 -
 204
204 -
 205
205 -
 206
206 -
207
-
208
-
209
-
210
-
211
-
212
-
213
-
214
-
215
-
216
-
217
-
218
-
219
-
220
-
221
-
222
-
223
-
224
-
225
-
226
-
227
-
228
-
229
-
230
-
231
-
232
-
233
-
234
-
235
-
236
-
237
-
238
-
239
-
240
-
241
-
242
-
243
-
244
-
245
-
246
-
247
-
248
-
249
-
250
-
251
-
252
-
253
 |
 |

CAPITAL ONE FINANCIAL CORPORATION
NOTES TO CONSOLIDATED FINANCIAL STATEMENTS
177 Capital One Financial Corporation (COF)
the risk of counterparty default, we enter into legally enforceable master netting agreements and maintain collateral agreements
with certain derivative counterparties. We generally enter into these agreements on a bilateral basis with our counterparties; however,
since June 2013 we have begun to clear eligible OTC derivatives through a central clearinghouse in accordance with the requirements
of the Dodd-Frank Act. These agreements typically provide for the right to offset exposures and require both parties to maintain
collateral in the event the fair values of derivative financial instruments exceed established thresholds. We received cash collateral
from derivatives counterparties totaling $544 million and $695 million as of December 31, 2015 and 2014, respectively. We also
received securities from derivatives counterparties with a fair value of $172 million and $91 million as of December 31, 2015 and
2014, respectively, which we have the ability to re-pledge.
We record counterparty credit risk valuation adjustments on our derivative assets to properly reflect the credit quality of the
counterparty. We consider collateral and legally enforceable master netting agreements that mitigate our credit exposure to each
counterparty in determining the counterparty credit risk valuation adjustment, which may be adjusted in future periods due to
changes in the fair value of the derivatives contracts, collateral and creditworthiness of the counterparty. The cumulative
counterparty credit risk valuation adjustment recorded on our consolidated balance sheets as a reduction in the derivatives asset
balance was $4 million and $5 million as of December 31, 2015 and 2014, respectively. We also adjust the fair value of our
derivatives liabilities to reflect the impact of our own credit quality. We calculate this adjustment by comparing the spreads on our
credit default swaps to the discount benchmark curve. The cumulative credit risk valuation adjustment related to our credit quality
recorded on our consolidated balance sheets as a reduction in the derivative liability balance was less than $1 million and $1 million
as of December 31, 2015 and 2014, respectively.
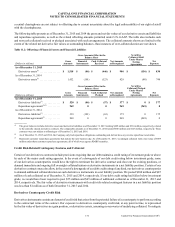
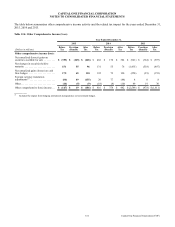
Income Statement Presentation and AOCI
The following tables summarize the impact of derivatives and the related hedged items in our consolidated statements of income
and AOCI.
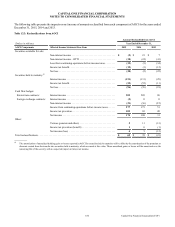
Fair Value Hedges and Free-Standing Derivatives
The net gains (losses) recognized in earnings related to derivatives in fair value hedging relationships and free-standing derivatives
are presented below for the years ended December 31, 2015, 2014 and 2013.
Table 11.3: Gains and Losses on Fair Value Hedges and Free-Standing Derivatives
Year Ended December 31,
(Dollars in millions) 2015 2014 2013
Derivatives designated as accounting hedges:(1)
Fair value interest rate contracts:
(Losses) gains recognized in earnings on derivatives . . . . . . . . . . . . . . . . . . . . . . . . . . . . . . . $ (66) $ 200 $ (550)
Gains (losses) recognized in earnings on hedged items . . . . . . . . . . . . . . . . . . . . . . . . . . . . . 75 (157) 507
Net fair value hedge ineffectiveness gains (losses) . . . . . . . . . . . . . . . . . . . . . . . . . . . . . . . . . . . 943 (43)
Derivatives not designated as accounting hedges:(1)
Interest rate contracts covering:
MSRs. . . . . . . . . . . . . . . . . . . . . . . . . . . . . . . . . . . . . . . . . . . . . . . . . . . . . . . . . . . . . . . . . . . . 323 (12)
Customer accommodation. . . . . . . . . . . . . . . . . . . . . . . . . . . . . . . . . . . . . . . . . . . . . . . . . . . . 21 18 49
Other interest rate exposures. . . . . . . . . . . . . . . . . . . . . . . . . . . . . . . . . . . . . . . . . . . . . . . . . . 44 11 (9)
Total interest rate contracts. . . . . . . . . . . . . . . . . . . . . . . . . . . . . . . . . . . . . . . . . . . . . . . . . . . . . . 68 52 28
Foreign exchange contracts . . . . . . . . . . . . . . . . . . . . . . . . . . . . . . . . . . . . . . . . . . . . . . . . . . . . . 01 (5)
Other contracts . . . . . . . . . . . . . . . . . . . . . . . . . . . . . . . . . . . . . . . . . . . . . . . . . . . . . . . . . . . . . . . (2) (1) (20)
Total gains on derivatives not designated as accounting hedges . . . . . . . . . . . . . . . . . . . . . . . . . 66 52 3
Net derivative gains (losses) recognized in earnings . . . . . . . . . . . . . . . . . . . . . . . . . . . . . . . . . . $ 75 $ 95 $ (40)
__________
(1) Amounts are recorded in our consolidated statements of income in other non-interest income.