Capital One 2015 Annual Report Download - page 174
Download and view the complete annual report
Please find page 174 of the 2015 Capital One annual report below. You can navigate through the pages in the report by either clicking on the pages listed below, or by using the keyword search tool below to find specific information within the annual report.-
 1
1 -
2
-
3
-
4
-
5
-
6
-
7
-
8
-
9
-
10
-
11
-
12
-
13
-
14
-
15
-
16
-
17
-
18
-
19
-
20
-
21
-
22
-
23
-
24
-
25
-
26
-
27
-
28
-
29
-
30
-
31
-
32
-
33
-
34
-
35
-
36
-
37
-
38
-
39
-
40
-
41
-
42
-
43
-
44
-
45
-
46
-
47
-
48
-
49
-
50
-
51
-
52
-
53
-
54
-
55
-
56
-
57
-
58
-
59
-
60
-
61
-
62
-
63
-
64
-
65
-
66
-
67
-
68
-
69
-
70
-
71
-
72
-
73
-
74
-
75
-
76
-
77
-
78
-
79
-
80
-
81
-
82
-
83
-
84
-
85
-
86
-
87
-
88
-
89
-
90
-
91
-
92
-
93
-
94
-
95
-
96
-
97
-
98
-
99
-
100
-
101
-
102
-
103
-
104
-
105
-
106
-
107
-
108
-
109
-
110
-
111
-
112
-
113
-
114
-
115
-
116
-
117
-
118
-
119
-
120
-
121
-
122
-
123
-
124
-
125
-
126
-
127
-
128
-
129
-
130
-
131
-
132
-
133
-
134
-
135
-
136
-
137
-
138
-
139
-
140
-
141
-
142
-
143
-
144
-
145
-
146
-
147
-
148
-
149
-
150
-
151
-
152
-
153
-
154
-
155
-
156
-
157
-
158
-
159
-
160
-
161
-
162
-
163
-
 164
164 -
 165
165 -
 166
166 -
 167
167 -
 168
168 -
 169
169 -
 170
170 -
 171
171 -
 172
172 -
 173
173 -
 174
174 -
 175
175 -
 176
176 -
 177
177 -
 178
178 -
 179
179 -
 180
180 -
 181
181 -
 182
182 -
 183
183 -
 184
184 -
185
-
186
-
187
-
188
-
189
-
190
-
191
-
192
-
193
-
194
-
195
-
196
-
197
-
198
-
199
-
200
-
201
-
202
-
203
-
204
-
205
-
206
-
207
-
208
-
209
-
210
-
211
-
212
-
213
-
214
-
215
-
216
-
217
-
218
-
219
-
220
-
221
-
222
-
223
-
224
-
225
-
226
-
227
-
228
-
229
-
230
-
231
-
232
-
233
-
234
-
235
-
236
-
237
-
238
-
239
-
240
-
241
-
242
-
243
-
244
-
245
-
246
-
247
-
248
-
249
-
250
-
251
-
252
-
253
 |
 |

CAPITAL ONE FINANCIAL CORPORATION
NOTES TO CONSOLIDATED FINANCIAL STATEMENTS
155 Capital One Financial Corporation (COF)
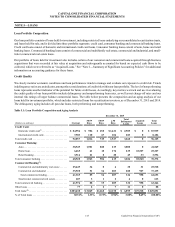
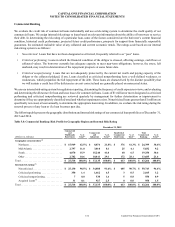
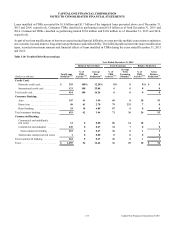
Loans modified in TDRs accounted for $1.8 billion and $1.7 billion of the impaired loans presented above as of December 31,
2015 and 2014, respectively. Consumer TDRs classified as performing totaled $1.0 billion as of both December 31, 2015 and
2014. Commercial TDRs classified as performing totaled $334 million and $194 million as of December 31, 2015 and 2014,
respectively.
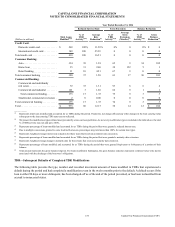
As part of our loan modifications to borrowers experiencing financial difficulty, we may provide multiple concessions to minimize
our economic loss and improve long-term loan performance and collectability. The following tables present the major modification
types, recorded investment amounts and financial effects of loans modified in TDRs during the years ended December 31, 2015
and 2014:
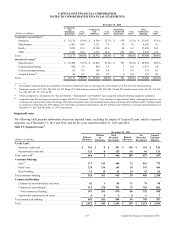
Table 5.10: Troubled Debt Restructurings
Total Loans
Modified(1)(2)
Year Ended December 31, 2015
Reduced Interest Rate Term Extension Balance Reduction
(Dollars in millions)
% of
TDR
Activity(3)(4)
Average
Rate
Reduction(5)
% of
TDR
Activity(4)(6)
Average
Term
Extension
(Months)(7)
% of
TDR
Activity(4)(8)
Gross
Balance
Reduction(9)
Credit Card:
Domestic credit card. . . . . . . . . . . . . . $ 293 100% 12.28% 0% 0 0% $ 0
International credit card . . . . . . . . . . . 121 100 25.88 0 0 0 0
Total credit card. . . . . . . . . . . . . . . . . . . . 414 100 16.26 0 0 0 0
Consumer Banking:
Auto . . . . . . . . . . . . . . . . . . . . . . . . . . 347 41 3.49 69 8 30 93
Home loan . . . . . . . . . . . . . . . . . . . . . 48 61 2.70 79 231 7 0
Retail banking. . . . . . . . . . . . . . . . . . . 24 18 6.88 87 6 0 0
Total consumer banking. . . . . . . . . . . . . . 419 42 3.44 71 36 26 93
Commercial Banking:
Commercial and multifamily
real estate . . . . . . . . . . . . . . . . . . . . . . 12 0 0.00 86 14 18 1
Commercial and industrial . . . . . . . . . 249 0 0.67 34 7 0 0
Total commercial lending . . . . . . . . 261 0 0.67 36 8 1 1
Small-ticket commercial real estate . . 1 0 0.00 0 0 0 0
Total commercial banking . . . . . . . . . . . . 262 0 0.67 36 8 1 1
Total. . . . . . . . . . . . . . . . . . . . . . . . . . . . . $ 1,095 54 12.42 36 29 10 $ 94