Capital One 2015 Annual Report Download - page 202
Download and view the complete annual report
Please find page 202 of the 2015 Capital One annual report below. You can navigate through the pages in the report by either clicking on the pages listed below, or by using the keyword search tool below to find specific information within the annual report.-
 1
1 -
2
-
3
-
4
-
5
-
6
-
7
-
8
-
9
-
10
-
11
-
12
-
13
-
14
-
15
-
16
-
17
-
18
-
19
-
20
-
21
-
22
-
23
-
24
-
25
-
26
-
27
-
28
-
29
-
30
-
31
-
32
-
33
-
34
-
35
-
36
-
37
-
38
-
39
-
40
-
41
-
42
-
43
-
44
-
45
-
46
-
47
-
48
-
49
-
50
-
51
-
52
-
53
-
54
-
55
-
56
-
57
-
58
-
59
-
60
-
61
-
62
-
63
-
64
-
65
-
66
-
67
-
68
-
69
-
70
-
71
-
72
-
73
-
74
-
75
-
76
-
77
-
78
-
79
-
80
-
81
-
82
-
83
-
84
-
85
-
86
-
87
-
88
-
89
-
90
-
91
-
92
-
93
-
94
-
95
-
96
-
97
-
98
-
99
-
100
-
101
-
102
-
103
-
104
-
105
-
106
-
107
-
108
-
109
-
110
-
111
-
112
-
113
-
114
-
115
-
116
-
117
-
118
-
119
-
120
-
121
-
122
-
123
-
124
-
125
-
126
-
127
-
128
-
129
-
130
-
131
-
132
-
133
-
134
-
135
-
136
-
137
-
138
-
139
-
140
-
141
-
142
-
143
-
144
-
145
-
146
-
147
-
148
-
149
-
150
-
151
-
152
-
153
-
154
-
155
-
156
-
157
-
158
-
159
-
160
-
161
-
162
-
163
-
164
-
165
-
166
-
167
-
168
-
169
-
170
-
171
-
172
-
173
-
174
-
175
-
176
-
177
-
178
-
179
-
180
-
181
-
182
-
183
-
184
-
185
-
186
-
187
-
188
-
189
-
190
-
191
-
 192
192 -
 193
193 -
 194
194 -
 195
195 -
 196
196 -
 197
197 -
 198
198 -
 199
199 -
 200
200 -
 201
201 -
 202
202 -
 203
203 -
 204
204 -
 205
205 -
 206
206 -
 207
207 -
 208
208 -
 209
209 -
 210
210 -
 211
211 -
 212
212 -
213
-
214
-
215
-
216
-
217
-
218
-
219
-
220
-
221
-
222
-
223
-
224
-
225
-
226
-
227
-
228
-
229
-
230
-
231
-
232
-
233
-
234
-
235
-
236
-
237
-
238
-
239
-
240
-
241
-
242
-
243
-
244
-
245
-
246
-
247
-
248
-
249
-
250
-
251
-
252
-
253
 |
 |

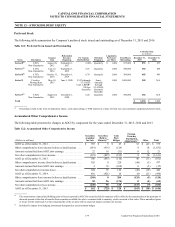
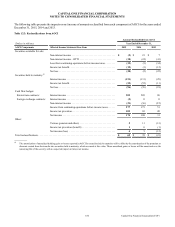
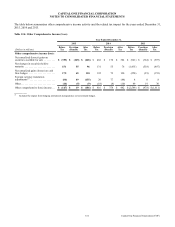
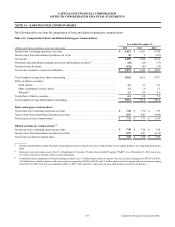
CAPITAL ONE FINANCIAL CORPORATION
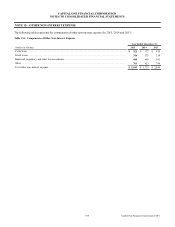
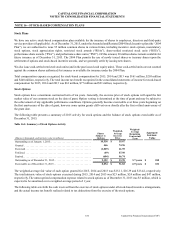
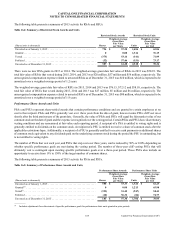
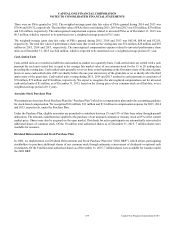
NOTES TO CONSOLIDATED FINANCIAL STATEMENTS
183 Capital One Financial Corporation (COF)
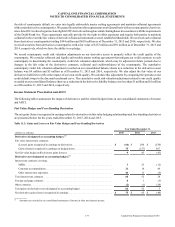
Table 13.1: Capital Ratios Under Basel III(1)
December 31, 2015 December 31, 2014
(Dollars in millions)
Capital
Amount
Capital
Ratio
Minimum
Capital
Adequacy
Well-
Capitalized
Capital
Amount
Capital
Ratio
Minimum
Capital
Adequacy
Well-
Capitalized
Capital One Financial Corp:
Common equity Tier 1 capital(2) . . . . . . $ 29,544 11.1% 4.5% N/A $ 29,534 12.5% 4.0% N/A
Tier 1 capital(3) . . . . . . . . . . . . . . . . . . . 32,838 12.4 6.0 6.0% 31,355 13.2 5.5 6.0%
Total capital(4) . . . . . . . . . . . . . . . . . . . . 38,838 14.6 8.0 10.0 35,879 15.1 8.0 10.0
Tier 1 leverage(5) . . . . . . . . . . . . . . . . . . 32,838 10.6 4.0 N/A 31,355 10.8 4.0 N/A
Supplementary leverage ratio(6) . . . . . . 357,794 9.2 N/A N/A N/A N/A N/A N/A
Capital One Bank (USA), N.A.:
Common equity Tier 1 capital(2) . . . . . . $ 10,644 12.2% 4.5% 6.5% $ 8,503 11.3% 4.0% N/A
Tier 1 capital(3) . . . . . . . . . . . . . . . . . . . 10,644 12.2 6.0 8.0 8,503 11.3 5.5 6.0%
Total capital(4) . . . . . . . . . . . . . . . . . . . . 13,192 15.2 8.0 10.0 10,938 14.6 8.0 10.0
Tier 1 leverage(5) . . . . . . . . . . . . . . . . . . 10,644 10.8 4.0 5.0 8,503 9.6 4.0 5.0
Supplementary leverage ratio(6) . . . . . . 118,859 9.0 N/A N/A N/A N/A N/A N/A
Capital One, N.A.:
Common equity Tier 1 capital(2) . . . . . . $ 21,765 11.8% 4.5% 6.5% $ 21,136 12.5% 4.0% N/A
Tier 1 capital(3) . . . . . . . . . . . . . . . . . . . 21,765 11.8 6.0 8.0 21,136 12.5 5.5 6.0%
Total capital(4) . . . . . . . . . . . . . . . . . . . . 23,832 12.9 8.0 10.0 22,881 13.6 8.0 10.0
Tier 1 leverage(5) . . . . . . . . . . . . . . . . . . 21,765 8.8 4.0 5.0 21,136 8.9 4.0 5.0
Supplementary leverage ratio(6) . . . . . . 276,132 7.9 N/A N/A N/A N/A N/A N/A
__________
(1) Capital ratios are calculated based on the Basel III Standardized Approach framework, subject to applicable transition provisions. As we continue to refine
our classification of exposures under the Basel III Standardized Approach framework, risk-weighted asset classifications are subject to change.
(2) Common equity Tier 1 capital ratio is a regulatory capital measure calculated based on common equity Tier 1 capital divided by risk-weighted assets.
(3) Tier 1 capital ratio is a regulatory capital measure calculated based on Tier 1 capital divided by risk-weighted assets.
(4) Total capital ratio is a regulatory capital measure calculated based on total capital divided by risk-weighted assets.
(5) Tier 1 leverage ratio is a regulatory capital measure calculated based on Tier 1 capital divided by average assets, after certain adjustments.
(6) Supplementary leverage ratio is a regulatory capital measure calculated based on Tier 1 capital under the Basel III Standardized Approach divided by total
leverage exposure.
Capital One Financial Corporation exceeded Federal Banking Agencies’ minimum capital requirements and the Banks exceeded
minimum regulatory requirements and were “well-capitalized” under PCA requirements as of December 31, 2015 and 2014.
Regulatory restrictions exist that limit the ability of the Banks to transfer funds to our BHC. Funds available for dividend payments
from COBNA and CONA were $2.9 billion and $359 million, respectively, as of December 31, 2015. Applicable provisions that
may be contained in our borrowing agreements or the borrowing agreements of our subsidiaries may limit our subsidiaries’ ability
to pay dividends to us or our ability to pay dividends to our stockholders. There can be no assurance that we will declare and pay
any dividends.