Capital One 2015 Annual Report Download - page 160
Download and view the complete annual report
Please find page 160 of the 2015 Capital One annual report below. You can navigate through the pages in the report by either clicking on the pages listed below, or by using the keyword search tool below to find specific information within the annual report.-
 1
1 -
2
-
3
-
4
-
5
-
6
-
7
-
8
-
9
-
10
-
11
-
12
-
13
-
14
-
15
-
16
-
17
-
18
-
19
-
20
-
21
-
22
-
23
-
24
-
25
-
26
-
27
-
28
-
29
-
30
-
31
-
32
-
33
-
34
-
35
-
36
-
37
-
38
-
39
-
40
-
41
-
42
-
43
-
44
-
45
-
46
-
47
-
48
-
49
-
50
-
51
-
52
-
53
-
54
-
55
-
56
-
57
-
58
-
59
-
60
-
61
-
62
-
63
-
64
-
65
-
66
-
67
-
68
-
69
-
70
-
71
-
72
-
73
-
74
-
75
-
76
-
77
-
78
-
79
-
80
-
81
-
82
-
83
-
84
-
85
-
86
-
87
-
88
-
89
-
90
-
91
-
92
-
93
-
94
-
95
-
96
-
97
-
98
-
99
-
100
-
101
-
102
-
103
-
104
-
105
-
106
-
107
-
108
-
109
-
110
-
111
-
112
-
113
-
114
-
115
-
116
-
117
-
118
-
119
-
120
-
121
-
122
-
123
-
124
-
125
-
126
-
127
-
128
-
129
-
130
-
131
-
132
-
133
-
134
-
135
-
136
-
137
-
138
-
139
-
140
-
141
-
142
-
143
-
144
-
145
-
146
-
147
-
148
-
149
-
 150
150 -
 151
151 -
 152
152 -
 153
153 -
 154
154 -
 155
155 -
 156
156 -
 157
157 -
 158
158 -
 159
159 -
 160
160 -
 161
161 -
 162
162 -
 163
163 -
 164
164 -
 165
165 -
 166
166 -
 167
167 -
 168
168 -
 169
169 -
 170
170 -
171
-
172
-
173
-
174
-
175
-
176
-
177
-
178
-
179
-
180
-
181
-
182
-
183
-
184
-
185
-
186
-
187
-
188
-
189
-
190
-
191
-
192
-
193
-
194
-
195
-
196
-
197
-
198
-
199
-
200
-
201
-
202
-
203
-
204
-
205
-
206
-
207
-
208
-
209
-
210
-
211
-
212
-
213
-
214
-
215
-
216
-
217
-
218
-
219
-
220
-
221
-
222
-
223
-
224
-
225
-
226
-
227
-
228
-
229
-
230
-
231
-
232
-
233
-
234
-
235
-
236
-
237
-
238
-
239
-
240
-
241
-
242
-
243
-
244
-
245
-
246
-
247
-
248
-
249
-
250
-
251
-
252
-
253
 |
 |

CAPITAL ONE FINANCIAL CORPORATION
NOTES TO CONSOLIDATED FINANCIAL STATEMENTS
141 Capital One Financial Corporation (COF)
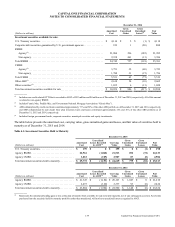
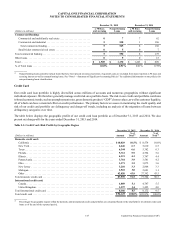
2015, our investments in non-agency RMBS and CMBS, other ABS, and other securities accounted for $53 million, or 17%, of
total gross unrealized losses on securities available for sale. As of December 31, 2015, the carrying value of approximately 100
securities classified as held to maturity exceeded their fair value by $81 million.
Gross unrealized losses on our investment securities have increased since December 31, 2014. The unrealized losses related to
investment securities for which we have not recognized credit impairment were primarily attributable to changes in market interest
rates. As discussed in more detail below, we conduct periodic reviews of all investment securities with unrealized losses to assess
whether impairment is other-than-temporary.
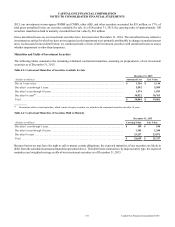
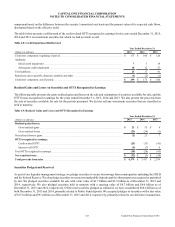
Maturities and Yields of Investment Securities
The following tables summarize the remaining scheduled contractual maturities, assuming no prepayments, of our investment
securities as of December 31, 2015.
Table 4.5: Contractual Maturities of Securities Available for Sale
December 31, 2015
(Dollars in millions) Amortized Cost Fair Value
Due in 1 year or less. . . . . . . . . . . . . . . . . . . . . . . . . . . . . . . . . . . . . . . . . . . . . . . . . . . . . . . . . . . . . . . . . . . . $ 1,116 $ 1,116
Due after 1 year through 5 years . . . . . . . . . . . . . . . . . . . . . . . . . . . . . . . . . . . . . . . . . . . . . . . . . . . . . . . . . . 5,592 5,589
Due after 5 years through 10 years. . . . . . . . . . . . . . . . . . . . . . . . . . . . . . . . . . . . . . . . . . . . . . . . . . . . . . . . . 1,574 1,593
Due after 10 years(1) . . . . . . . . . . . . . . . . . . . . . . . . . . . . . . . . . . . . . . . . . . . . . . . . . . . . . . . . . . . . . . . . . . . . 30,522 30,763
Total . . . . . . . . . . . . . . . . . . . . . . . . . . . . . . . . . . . . . . . . . . . . . . . . . . . . . . . . . . . . . . . . . . . . . . . . . . . . . . . . $ 38,804 $ 39,061
__________
(1) Investments with no stated maturities, which consist of equity securities, are included with contractual maturities due after 10 years.
Table 4.6: Contractual Maturities of Securities Held to Maturity
December 31, 2015
(Dollars in millions) Carrying Value Fair Value
Due after 1 year through 5 years . . . . . . . . . . . . . . . . . . . . . . . . . . . . . . . . . . . . . . . . . . . . . . . . . . . . . . . . . . $ 199 $ 198
Due after 5 years through 10 years . . . . . . . . . . . . . . . . . . . . . . . . . . . . . . . . . . . . . . . . . . . . . . . . . . . . . . . . 1,183 1,248
Due after 10 years . . . . . . . . . . . . . . . . . . . . . . . . . . . . . . . . . . . . . . . . . . . . . . . . . . . . . . . . . . . . . . . . . . . . . 23,237 23,871
Total. . . . . . . . . . . . . . . . . . . . . . . . . . . . . . . . . . . . . . . . . . . . . . . . . . . . . . . . . . . . . . . . . . . . . . . . . . . . . . . . $ 24,619 $ 25,317
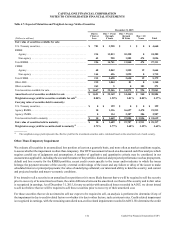
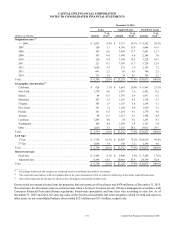
Because borrowers may have the right to call or prepay certain obligations, the expected maturities of our securities are likely to
differ from the scheduled contractual maturities presented above. The table below summarizes, by major security type, the expected
maturities and weighted-average yields of our investment securities as of December 31, 2015.