Capital One 2015 Annual Report Download - page 162
Download and view the complete annual report
Please find page 162 of the 2015 Capital One annual report below. You can navigate through the pages in the report by either clicking on the pages listed below, or by using the keyword search tool below to find specific information within the annual report.-
 1
1 -
2
-
3
-
4
-
5
-
6
-
7
-
8
-
9
-
10
-
11
-
12
-
13
-
14
-
15
-
16
-
17
-
18
-
19
-
20
-
21
-
22
-
23
-
24
-
25
-
26
-
27
-
28
-
29
-
30
-
31
-
32
-
33
-
34
-
35
-
36
-
37
-
38
-
39
-
40
-
41
-
42
-
43
-
44
-
45
-
46
-
47
-
48
-
49
-
50
-
51
-
52
-
53
-
54
-
55
-
56
-
57
-
58
-
59
-
60
-
61
-
62
-
63
-
64
-
65
-
66
-
67
-
68
-
69
-
70
-
71
-
72
-
73
-
74
-
75
-
76
-
77
-
78
-
79
-
80
-
81
-
82
-
83
-
84
-
85
-
86
-
87
-
88
-
89
-
90
-
91
-
92
-
93
-
94
-
95
-
96
-
97
-
98
-
99
-
100
-
101
-
102
-
103
-
104
-
105
-
106
-
107
-
108
-
109
-
110
-
111
-
112
-
113
-
114
-
115
-
116
-
117
-
118
-
119
-
120
-
121
-
122
-
123
-
124
-
125
-
126
-
127
-
128
-
129
-
130
-
131
-
132
-
133
-
134
-
135
-
136
-
137
-
138
-
139
-
140
-
141
-
142
-
143
-
144
-
145
-
146
-
147
-
148
-
149
-
150
-
151
-
 152
152 -
 153
153 -
 154
154 -
 155
155 -
 156
156 -
 157
157 -
 158
158 -
 159
159 -
 160
160 -
 161
161 -
 162
162 -
 163
163 -
 164
164 -
 165
165 -
 166
166 -
 167
167 -
 168
168 -
 169
169 -
 170
170 -
 171
171 -
 172
172 -
173
-
174
-
175
-
176
-
177
-
178
-
179
-
180
-
181
-
182
-
183
-
184
-
185
-
186
-
187
-
188
-
189
-
190
-
191
-
192
-
193
-
194
-
195
-
196
-
197
-
198
-
199
-
200
-
201
-
202
-
203
-
204
-
205
-
206
-
207
-
208
-
209
-
210
-
211
-
212
-
213
-
214
-
215
-
216
-
217
-
218
-
219
-
220
-
221
-
222
-
223
-
224
-
225
-
226
-
227
-
228
-
229
-
230
-
231
-
232
-
233
-
234
-
235
-
236
-
237
-
238
-
239
-
240
-
241
-
242
-
243
-
244
-
245
-
246
-
247
-
248
-
249
-
250
-
251
-
252
-
253
 |
 |

CAPITAL ONE FINANCIAL CORPORATION
NOTES TO CONSOLIDATED FINANCIAL STATEMENTS
143 Capital One Financial Corporation (COF)
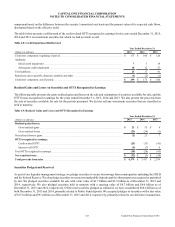
component based on the difference between the security’s amortized cost basis and the present value of its expected cash flows,
discounted based on the effective yield.
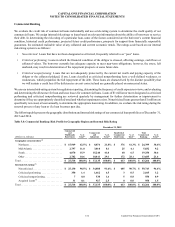
The table below presents a rollforward of the credit-related OTTI recognized in earnings for the years ended December 31, 2015,
2014 and 2013 on investment securities for which we had no intent to sell.
Table 4.8: Credit Impairment Rollforward
Year Ended December 31,
(Dollars in millions) 2015 2014 2013
Credit loss component, beginning of period . . . . . . . . . . . . . . . . . . . . . . . . . . . . . . . . . . . . . . . . . . . . . . . . $ 175 $ 160 $ 120
Additions:
Initial credit impairment . . . . . . . . . . . . . . . . . . . . . . . . . . . . . . . . . . . . . . . . . . . . . . . . . . . . . . . . . . . . 75 14
Subsequent credit impairment . . . . . . . . . . . . . . . . . . . . . . . . . . . . . . . . . . . . . . . . . . . . . . . . . . . . . . . . 18 12 27
Total additions. . . . . . . . . . . . . . . . . . . . . . . . . . . . . . . . . . . . . . . . . . . . . . . . . . . . . . . . . . . . . . . . . . . . . . . 25 17 41
Reductions due to payoffs, disposals, transfers and other. . . . . . . . . . . . . . . . . . . . . . . . . . . . . . . . . . . . . . (1) (2) (1)
Credit loss component, end of period . . . . . . . . . . . . . . . . . . . . . . . . . . . . . . . . . . . . . . . . . . . . . . . . . . . . . $ 199 $ 175 $ 160
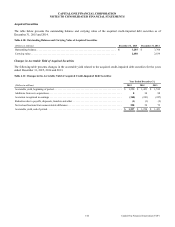
Realized Gains and Losses on Securities and OTTI Recognized in Earnings
The following table presents the gross realized gains and losses on the sale and redemption of securities available for sale, and the
OTTI losses recognized in earnings for the years ended December 31, 2015, 2014 and 2013. We also present the proceeds from
the sale of securities available for sale for the periods presented. We did not sell any investment securities that are classified as
held to maturity.
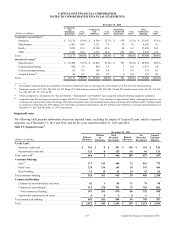
Table 4.9: Realized Gains and Losses and OTTI Recognized in Earnings
Year Ended December 31,
(Dollars in millions) 2015 2014 2013
Realized gains (losses):
Gross realized gains . . . . . . . . . . . . . . . . . . . . . . . . . . . . . . . . . . . . . . . . . . . . . . . . . . . . . . . . . . . . . . . . $ 23 $ 55 $ 8
Gross realized losses . . . . . . . . . . . . . . . . . . . . . . . . . . . . . . . . . . . . . . . . . . . . . . . . . . . . . . . . . . . . . . . (25) (34) (1)
Net realized (losses) gains. . . . . . . . . . . . . . . . . . . . . . . . . . . . . . . . . . . . . . . . . . . . . . . . . . . . . . . . . . . . . . (2) 21 7
OTTI recognized in earnings:
Credit-related OTTI . . . . . . . . . . . . . . . . . . . . . . . . . . . . . . . . . . . . . . . . . . . . . . . . . . . . . . . . . . . . . . . . (25) (17) (41)
Intent-to-sell OTTI. . . . . . . . . . . . . . . . . . . . . . . . . . . . . . . . . . . . . . . . . . . . . . . . . . . . . . . . . . . . . . . . . (5) (7) 0
Total OTTI recognized in earnings . . . . . . . . . . . . . . . . . . . . . . . . . . . . . . . . . . . . . . . . . . . . . . . . . . . . . . . (30) (24) (41)
Net securities losses . . . . . . . . . . . . . . . . . . . . . . . . . . . . . . . . . . . . . . . . . . . . . . . . . . . . . . . . . . . . . . . . . . $ (32) $ (3) $ (34)
Total proceeds from sales . . . . . . . . . . . . . . . . . . . . . . . . . . . . . . . . . . . . . . . . . . . . . . . . . . . . . . . . . . . . . $ 4,379 $ 7,417 $ 2,539
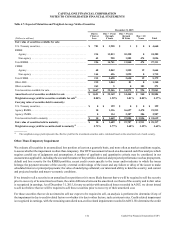
Securities Pledged and Received
As part of our liquidity management strategy, we pledge securities to secure borrowings from counterparties including the FHLB
and the Federal Reserve. We also pledge securities to secure trust and public deposits and for other purposes as required or permitted
by law. We pledged securities available for sale with a fair value of $1.7 billion and $3.5 billion as of December 31, 2015 and
2014, respectively. We also pledged securities held to maturity with a carrying value of $8.7 billion and $9.0 billion as of
December 31, 2015 and 2014, respectively. Of the total securities pledged as collateral, we have encumbered $10.6 billion as of
both December 31, 2015 and 2014, primarily related to Public Fund deposits. We accepted pledges of securities with a fair value
of $172 million and $91 million as of December 31, 2015 and 2014, respectively, primarily related to our derivative transactions.